July 2022
State of Omnichannel Field Engagement
Each quarter, we’ll provide unique insights into the most important global and regional trends for
omnichannel field engagement, giving an exclusive view into when, where, and how field teams
and healthcare professionals (HCPs) interact.
The Veeva Pulse Field Trends Report reflects data and insights from field engagement activities
of more than 80% of all industry representatives worldwide.1 Veeva CRM Standard Metrics
– now used industrywide – provides the basis for consistent collection and measurement
of engagement KPIs such as channel mix and productivity across regions, roles, and market
segments.
With these insights, you can now benchmark performance and set the right actionable goals.
For example, video calls deliver three times greater promotional response from HCPs versus
in-person meetings alone and leaders are gaining an advantage by using video calls three
times weekly.
For Boehringer Ingelheim, Veeva Pulse Insights “bring an additional level of clarity that
strengthens the way we make informed decisions,” says BI’s head of customer-facing execution
excellence, Carol-Ann Krupka.
Given the rapidly evolving state of customer engagement, I’m excited to be able to share these
valuable insights with you every quarter.
Looking forward to continuing to innovate together to achieve true commercial excellence.
Thank you,

Dan Rizzo
Vice President, Business Consulting, Veeva
VEEVA PULSE INSIGHT:
Video Calls 3x More Effective,
Leaders Gain Advantage Using Them 3 Times Week
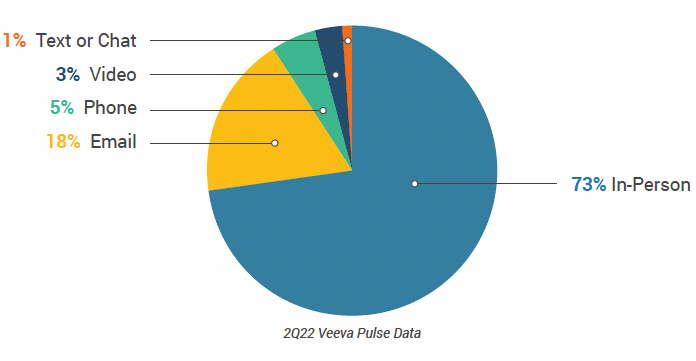
When it began, the pandemic forced nearly all engagement online. As restrictions give way to
more in-person opportunities, new Pulse Insights reveal there’s now a 70/30 mix of in-person
to virtual engagement (video, chat or text, phone, and email).
Data show the companies making widespread investments in omnichannel engagement – that
fully leverage digital and in-person – are seeing the greatest improvements in efficiency, customer
experience, and customer access. And 75% of HCPs2 report they want to keep or increase digital
interactions with reps.
The use of video meetings in conjunction with in-person meetings increases efficiency and
impact. When engaging HCPs through a blend of in-person and virtual channels, such as Veeva
CRM Engage, video engagement has three times the promotional response compared to in-person
meetings alone, offering a significant advantage (see Figure 5).3
HCP ENGAGEMENT TRENDS IN 2022
75%
HCPs want to keep or
increase digital interactions2
3x
Greater promotional response
from video meetings when
combined with in-person3
3x
Leaders average up to three
video meetings per week
Virtual engagement is a natural complement and accelerator to in-person and has tremendous
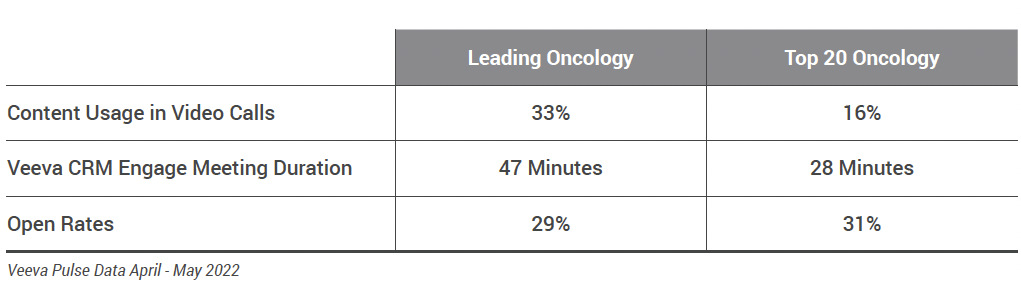
benefits to the customer experience. As Veeva Pulse data show, the top three leading U.S.
oncology franchises use video meetings 2.5 times more, use content twice as much, and have
67% longer meetings compared to their peers (see Figure 1). Importantly, they use these meetings
to complement in-person selling efforts, extending the conversation and deepening relationships
with digital touchpoints between in-person meetings.
FIGURE 1: VIRTUAL ENGAGEMENT IN ONCOLOGY
LEADING ONCOLOGY (TOP 3)
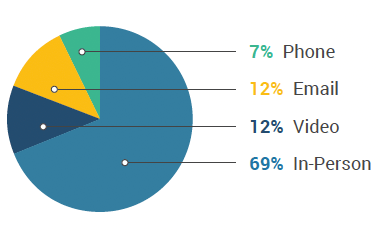
TOP 20 ONCOLOGY
Using newer channels like chat and text, as well as expanding the use of video and email, some
companies are realizing the benefit of “pull” models where HCPs reach out directly for information
alongside their traditional “push” outreach tactics. This model allows HCPs to engage via their
preferred channels at times that are most convenient, for more in-depth conversations with the
representatives they trust.
Companies leading in omnichannel engagement have established a platform for this “pull” model
where HCPs can engage in two-way communication as a key part of the mix. These reps are top
of mind and easy to reach when HCPs need information, samples, or to schedule a virtual or live
meeting.
As a result, three distinct levels of rep engagement have emerged, with significant impact on
access, brand perception, and engagement. At baseline, reps are back in-person, building HCP
relationships. At the next level, reps also use HCPs’ preferred channels to establish in-depth,
trusted touchpoints. But the very best reps build deep in-person and digital connections that
ensure they are sought after and easy to reach, even when they’re not physically present. In effect,
the best reps never leave the room.
VEEVA PULSE INSIGHT:
Digital Trends
1. The return of in-person, and greater expectations from HCPs
After COVID-19 forced companies to shift to a new digital engagement model overnight, a question
remained: will the industry eventually return to an in-person status quo, or will a new blended model
emerge? Veeva Pulse data show in-person now accounts for roughly 70% of HCP interactions
globally from April to June 2022 (Figure 2). Although in-person is again the predominant channel,
now that 75% of HCPs expect a blend of digital engagement, field teams are evolving to a new
omnichannel model.4
FIGURE 2: GLOBAL CHANNEL MIX
The channel mix and rate of return to in-person have not been the same everywhere. For example,
the U.K. is an outlier among major markets, with significantly lower activity across all channels.
The U.K. has one of the lowest rates of HCP touchpoints at roughly 21 per user per week, of which
only 32% are in-person, and 43% are email (Figure 3).
FIGURE 3: U.K. CHANNEL MIX COMPARED TO MAJOR MARKETS

2. Leaders leverage video calls for richer and more frequent engagement
When engaging HCPs through a blend of in-person and virtual channels, CRM Engage video
meetings have three times the promotional response compared to in-person meetings alone,
offering a significant advantage (Figure 5). In addition to extending the conversation beyond
face-to-face, replacing phone calls with video meetings delivers a richer experience and greater
message delivery thanks to content and other visual aids. When engaging HCPs through a blend
of in-person and virtual channels, video meetings have three times the promotional response
compared to in-person meetings alone, offering a significant advantage.
FIGURE 4: WEEKLY VIRTUAL MEETING USAGE ACROSS COMPANIES

FIGURE 5: PROMOTIONAL RESPONSE COEFFICIENT


ACTION
Given HCPs want more digital engagement, video calls increase promotional response 3x,
and leaders are gaining greater mindshare using video calls 3x a week – ensure your mix and
frequency maximize the opportunity. Tailor field coaching and training to establish strong
video engagement behaviors.
3. Capitalizing on content with the right platform
Content is still king. The fundamental drivers of promotional response continue to be time with
the customer and content utilization. Although content usage in video meetings is consistently
higher than in-person, it can differ depending upon the platform. For example, content usage is
approximately 85% globally via Veeva CRM Engage meetings, compared to approximately 40% for
other video platforms (Figure 6). In addition, CRM Engage meeting duration averages 21 minutes
globally, which is four- to five-times longer than a typical in-person meeting and creates more
opportunities to share content.
FIGURE 6: WEEKLY CONTENT USAGE BY CHANNEL

ACTION
Is your content library robust enough to get the most out of your content during video
calls? And how can you drive higher content utilization during in-person meetings?
Ensure you have a fine-tuned content supply chain and operating model, effective
platforms for delivering content to customers, a modular content strategy, and field
force training on the role content plays in driving treatment starts.
Conclusion
The way pharma field teams engage with HCPs is shifting once again. Success hinges on
empowering field teams with data-driven insights to build the best omnichannel mix that engages
HCPs when and where they need it most.
Veeva Pulse Field Trends Reports, created with data and insights from field engagement
activities of more than 80% of all industry representatives worldwide, provide unique insights
into HCP engagement to benchmark against industry leaders and set actionable goals to achieve
commercial excellence.
VEEVA PULSE INSIGHT:
Global and Regional Views
Global trends
- Physician access returned, and the industry has prioritized getting back in front of customers.
Globally, in-person remains the dominant channel for HCP engagement, representing roughly
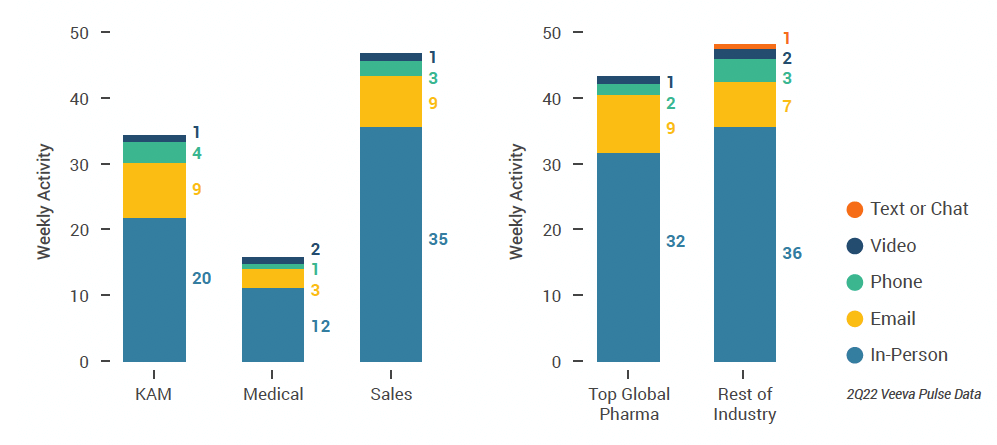
70% of activity in 2Q22 (Figure 8). - There are clear differences in the level and type of engagement between sales, key account
management (KAM), and field medical teams. As expected, volumes per user are lower with
field medical, and they deliver the highest number of video calls at 1.8 per user per week
globally (Figure 10). - Content usage in video engagement has remained relatively consistent over time; however,
we see a substantial difference in the proportion of video calls with tracked content among
various technology platforms. Tracked content usage through Veeva CRM Engage sits at
approximately 85% compared to 40% when looking at video calls on other platforms
(Figure 13).
FIGURE 7: CHANNEL MIX EVOLUTION

FIGURE 8: CHANNEL MIX

Global Field Team Activity
Weekly Activity Per User by Engagement Channel
FIGURE 9: BY REGION

FIGURE 10: BY USER TYPE
FIGURE 11: BY COMPANY SIZE
Global Engagement Quality
Consolidation of Key Quality Metrics
FIGURE 12: TRENDING VEEVA CRM APPROVED EMAIL VOLUME
VS OPEN RATE AND CLICK RATE

FIGURE 13: TRENDING CONTENT USAGE BY CHANNEL

FIGURE 14: ENGAGE MEETING DURATION

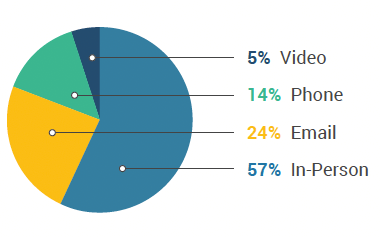
U.S. market trends
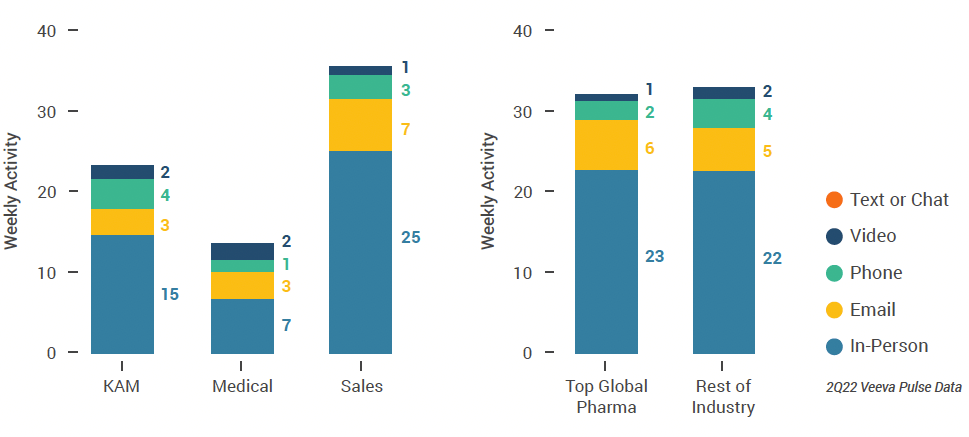
- The total volume of interactions gradually decreased over the two-month period across the
U.S. During this period, in-person engagement, which contributed 71% of activity in April,
fell to 68% in June. Over the same period, combined video and email channels increased
from approximately 20% to 24% of the channel mix (see Figure 15). - The volume of delivered Veeva CRM Approved Email remained consistent throughout the
quarter at approximately 300K weekly; however, open rates consistently declined by 5%
during the period, ending at 30% by the end of June (see Figure 20). - Content utilization via virtual meetings with Veeva CRM Engage is consistent at approximately
80%, with meetings lasting 21 minutes.
FIGURE 15: CHANNEL MIX EVOLUTION, U.S.

FIGURE 16: CHANNEL MIX, U.S.

U.S. Field Team Activity
Weekly Activity Per User by Engagement Channel
FIGURE 17: TRENDING PRODUCTIVITY, U.S.

FIGURE 18: BY USER TYPE
FIGURE 19: BY COMPANY SIZE
U.S. Engagement Quality
Consolidation of Key Quality Metrics
FIGURE 20: TRENDING APPROVED EMAIL VOLUME
VS. OPEN AND CLICK RATE, U.S.

FIGURE 21: TRENDING CONTENT USAGE BY CHANNEL, U.S.

FIGURE 22: ENGAGE MEETING DURATION, U.S.

Europe market trends
- In-person engagement is consistent at approximately 60% of the channel mix, with email the
second largest channel by volume at 30%. (See Figure 23). - Veeva CRM users in Spain recorded the highest volume of interactions per user than in any
other EU5 (France, Germany, Italy, Spain, United Kingdom) market by a large margin, with >46
in-person HCP interactions per week (see Figure 25). - Veeva CRM users in the U.K. recorded the lowest number of HCP touchpoints with 7 in-person
interactions per week. In-person access has not returned in the U.K. to the same degree as in
other European markets (see Figure 26).
FIGURE 23: CHANNEL MIX EVOLUTION, EUROPE

FIGURE 24: CHANNEL MIX, EUROPE

Europe Field Team Activity
Weekly Activity Per User by Engagement Channel
FIGURE 25: BY COUNTRY IN EUROPE

FIGURE 26: BY USER TYPE
FIGURE 27: BY COMPANY SIZE

Europe Engagement Quality
Consolidation of Key Quality Metrics
FIGURE 28: TRENDING APPROVED EMAIL VOLUME
VS. OPEN AND CLICK RATE, EUROPE

FIGURE 29: TRENDING CONTENT USAGE BY CHANNEL, EUROPE

FIGURE 30: ENGAGE MEETING DURATION, EUROPE

Asia Pacific market trends
- In-person engagement consistently makes up 70% to 75% of the channel mix in the Asia
Pacific region (see Figure 32). - Sales users in Asia Pacific are nearly twice as productive compared to KAMs, and three times
as productive compared to medical users with about 66 touchpoints per week (see Figure 34).
KAMs use the phone channel significantly more than sales and medical users. - Content utilization in the Asia Pacific region is exceptionally high, with approximately 95%
of virtual meetings on Veeva CRM Engage, 75% of video engagements, and 55% of in-person
engagements leveraging content. This usage is greater than any other major region in
each of the three channels (see Figure 37).
FIGURE 31: CHANNEL MIX EVOLUTION, ASIA PACIFIC

FIGURE 32: CHANNEL MIX, ASIA PACIFIC

Asia Pacific Field Team Activity
Weekly Activity Per User by Engagement Channel
FIGURE 33: BY COUNTRY IN ASIA PACIFIC REGION

FIGURE 34: BY USER TYPE
FIGURE 35: BY COMPANY SIZE

Asia Pacific Engagement Quality
Consolidation of Key Quality Metrics
FIGURE 36: TRENDING APPROVED EMAIL VOLUME
VS. OPEN AND CLICK RATE, ASIA PACIFIC

FIGURE 37: TRENDING CONTENT USAGE BY CHANNEL, ASIA PACIFIC

FIGURE 38: ENGAGE MEETING DURATION, ASIA PACIFIC

Latin America market trends
- In Latin America (Brazil, Columbia, Ecuador, Mexico, Peru), CRM activity volume has been
steady throughout 2Q22, with in-person engagement making up approximately 70% of the
overall channel mix (See Figure 39). Latin America is unique in its use of chat or text calls,
which consistently make up 2% to 3% of the channel mix. - Ecuador, Mexico, and Peru have notably higher average weekly total user productivity than
Brazil and Colombia. This difference is driven by in-person engagement, with 47 in-person
touchpoints per week in Ecuador versus 29 in-person touchpoints in Colombia (see Figure 41). - The volume of delivered Veeva CRM Approved Emails remained consistent throughout the
quarter; however, open rates consistently declined by approximately 5% during the period,
ending at 42% by the end of June (see Figure 44).
FIGURE 39: CHANNEL MIX EVOLUTION, LATIN AMERICA

FIGURE 40: CHANNEL MIX, LATIN AMERICA

Latin Amercia Field Team Activity
Weekly Activity Per User by Engagement Channel
FIGURE 41: BY COUNTRY IN LATIN AMERICA REGION

FIGURE 42: BY USER TYPE
FIGURE 43: BY COMPANY SIZE

Latin America Engagement Quality
Consolidation of Key Quality Metrics
FIGURE 44: TRENDING APPROVED EMAIL VOLUME
VS. OPEN AND CLICK RATE, LATIN AMERICA

FIGURE 45: TRENDING CONTENT USAGE BY CHANNEL, LATIN AMERICA

FIGURE 46: ENGAGE MEETING DURATION, LATIN AMERICA

Appendix: Data Dictionary
Metric Definitions
- Channel Mix Evolution Over Time: Weekly Veeva CRM activity volume broken down by the channel of engagement (in-person, phone, video, email, chat or text)
- Q2 Channel Mix: Total Veeva CRM activity volume for 2Q22 broken down by engagement channel percentage
- Weekly Activities Per User: The average weekly number of Veeva CRM activities submitted per number of users active in Veeva CRM
- Trending Approved Email Volume: Volume of approved emails sent via Veeva CRM
- Email Open Rate: Percentage of approved emails opened at least once out of all approved emails sent via Veeva CRM
- Email Click Rate: Percentage of approved emails clicked at least once out of all approved emails sent via Veeva CRM
- In-Person % Content Usage: Percentage of in-person engagements that leveraged content in Veeva CRM
- Video % Content Usage: Percentage of video engagements that leveraged content in Veeva CRM
- Engage Meeting % Content Usage: Percentage of Engage meetings that leveraged content in Veeva CRM
- Engage Meeting Duration: The average duration of Engage meetings in minutes
Engagement Channel Definitions
- In-Person: Submitted Calls with a CRM Standard Metrics Call Channel value of ‘In-Person’
- Phone: Submitted Calls with a CRM Standard Metrics Call Channel value of ‘Phone’
- Video: Veeva Engage Calls and Video Calls via other platforms that are then recorded as Calls in Veeva CRM with a Standard Metrics Call Channel value of ‘Video’
- Email: Approved Emails and Emails sent via other platforms that are then recorded as Calls in Veeva CRM with a Standard Metrics Call Channel value of ‘Email’
- Chat or Text: Submitted Calls with a CRM Standard Metrics Call Channel value of ‘Chat or Text’
User Type Definitions
- Sales: Users that have been classified with the ‘Sales’ value in the CRM Standard Metrics ‘User Type’ field
- Key Account Manager: Users that have been classified with the ‘Key Account Manager’ value in the CRM Standard Metrics ‘User Type’ field
- Medical: Users that have been classified with the ‘Medical’ value in the CRM Standard Metrics ‘User Type’ field
Company Size Definitions
- Top Global Pharma: Veeva CRM customers included in the Top 17 Pharma Companies based on Global Revenue
- Rest of Industry: All other Veeva CRM customers
1 Veeva Pulse Data, July 2022
2 “Doctors’ Changing Expectations of Pharma Are Here to Stay”, BCG, September 2021
3 Veeva Pulse and Veeva Data Cloud, January 2019–September 2021
4“Doctors’ Changing Expectations of Pharma Are Here to Stay,” BCG, September 2021