The Doctor is In(bound): Opening Up Two-Way Communication Doubles Digital Engagement
More than half of the life science industry’s R&D spend is on specialty medicines, and an estimated 70% of drugs in the pipeline today are potential first-in-class novel treatments. As therapies become more precise and patient populations get smaller, healthcare professionals (HCPs) want on-demand access to resources – in the moment of need – that help patients initiate treatment, from reimbursement support to site certification.
Biopharmas can respond by building on in-person touchpoints with inbound engagement capabilities that allow HCPs to reach out proactively outside of scheduled meetings and traditional detailing. Promotion-focused models incentivizing traditional measures like sales and frequency should give way to service-focused models that prioritize engagement quality and responsiveness on HCPs’ terms, strengthening the relationship.
Veeva Pulse data show that field teams who are responsive to HCPs’ needs in real time have a vastly different channel mix, with more than double the amount of digital touchpoints while maintaining or increasing in-person activity. These interactions drive better results, allowing field teams to share meaningful content and drive promotional impact.
As Dave Yates, global product director, GSK, says, “To communicate effectively across digital channels, you need to focus on responsiveness, adding value with the ability to give customers what they need, exactly when they need it.”
Read Veeva Business Consulting’s in-depth analysis to learn how your commercial team can create a service-focused engagement model that delivers with speed and value.
Thank you,

Dan Rizzo
Global Head of Veeva Business Consulting

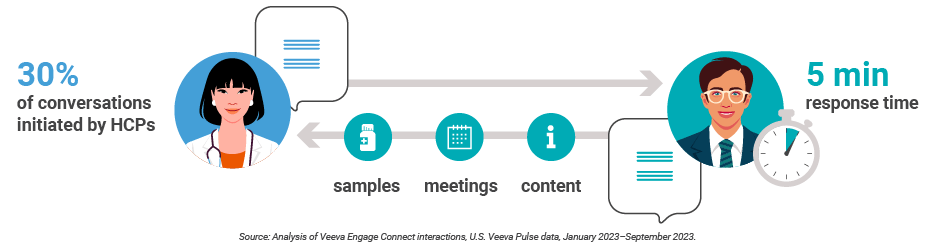
HCPs start 30% of conversations with an inbound channel, and reps can respond in real-time
Inbound channels create opportunities for HCPs to get the resources they need on their terms without waiting on scheduled rep visits. Veeva Pulse data shows that when a compliant chat channel is available, HCPs will start conversations 30% of the time.
Compliant chat allows reps to respond to HCPs’ needs with speed and value. On average, reps can respond on compliant chat in less than five minutes by answering questions with compliant content, sending samples for new patient starts, and scheduling meetings to dive into more detail. And, it has clear advantages over other channels like
text and stand-alone chat apps that pose compliance risks and fragment interaction data.
Establishing a compliant chat channel – and integrating it into your CRM platform – gives the home office and other field teams direct insight into HCPs’ needs and connects communication and critical follow-up actions across channels.
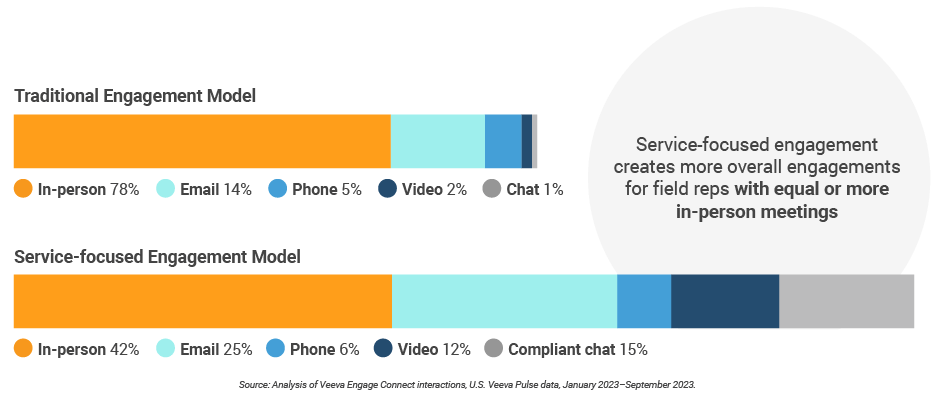
Inbound channels more than double digital engagement, keeping in-person the same or better
As in-person meetings return post-pandemic, they have come back in a different way. HCP access is more selective
than ever before, with most HCPs meeting with three or fewer companies. Eighty-four percent of healthcare professionals (HCPs) say they prefer to maintain or increase the share of virtual interactions with biopharmas.
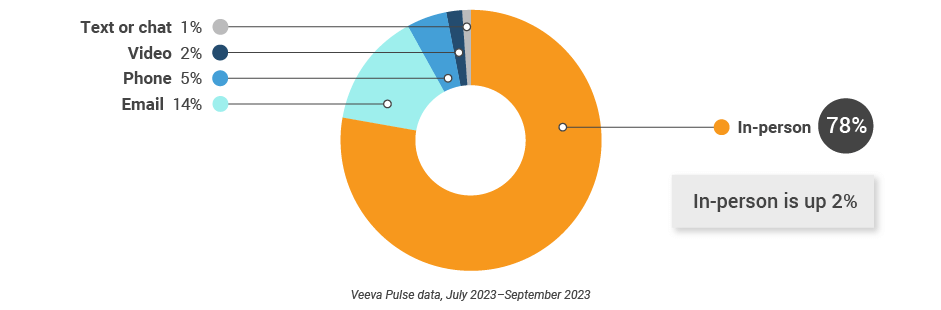
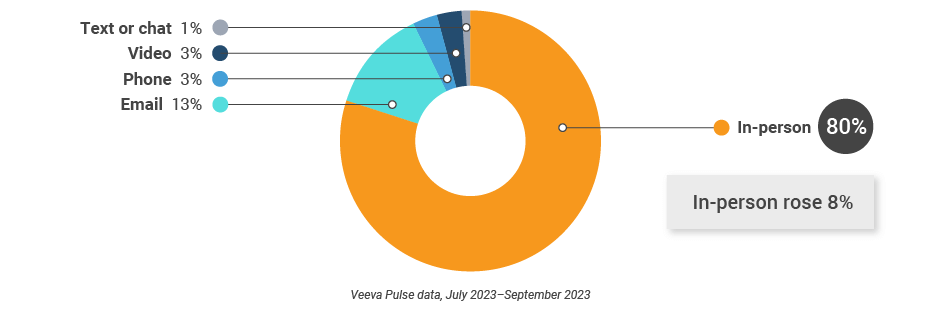
Digital channels – including inbound channels like compliant chat – strengthen the customer relationship with speed and value and increase engagement opportunities. Veeva Pulse data shows that the average global channel mix is 78% in-person and 22% digital. However, companies that supplement in-person and outbound tactics with inbound channels change that mix dramatically to 42% in-person and 58% digital. This approach more than doubles digital touchpoints – while keeping in-person volume the same or better.
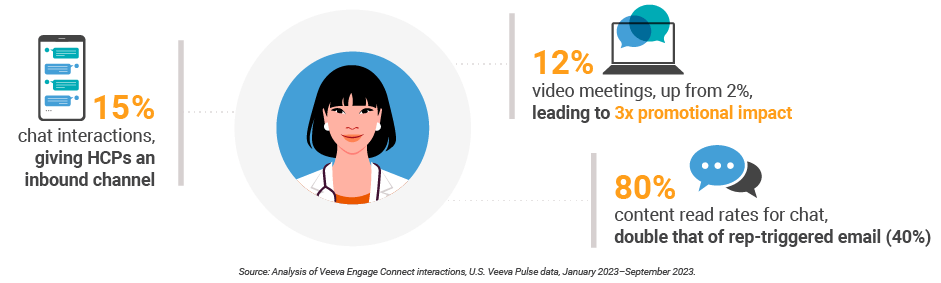
Responding in the moment of need doesn’t just increase interactions – it improves them
Delivering on HCPs’ needs in real-time significantly strengthens the HCP relationship, and improves access and efficiency. Reps in this new engagement model see:
A service-focused engagement model combines meaningful in-person touchpoints with responsive, real-time interactions in between meetings and in the moment of need. Early adopters are laying the groundwork with executive sponsorship, investments in compliant technology, and incentive realignment to focus on strength of relationship measures.
Reach out to Veeva Business Consulting to find out how you can use Veeva Pulse data to create a service-focused engagement model for your business.
Global and Regional Trends
This report highlights global and regional field engagement trends from Veeva Pulse data between July 2022 and
September 2023. Veeva Pulse data is sourced from Veeva’s aggregated CRM activity dataset, inclusive of field
engagement stats from all instances of Veeva CRM globally. Chart insights, unless otherwise noted, are year-overyear
comparisons.
Global trends
Figure 1: Channel mix evolution, global
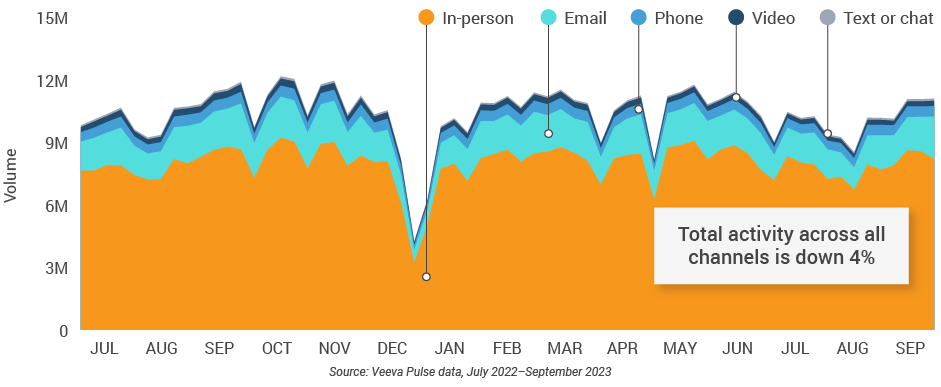
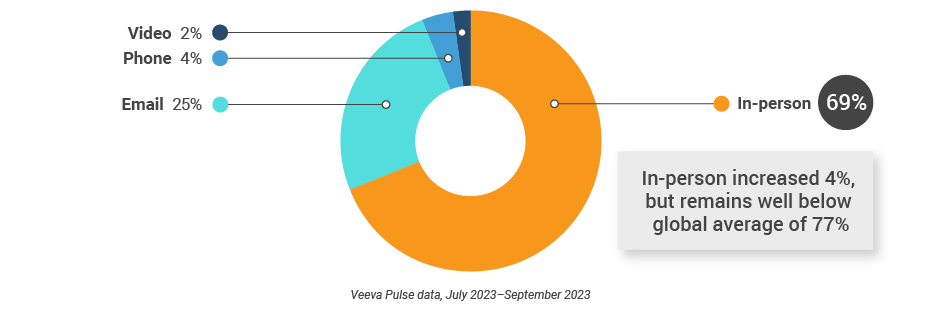
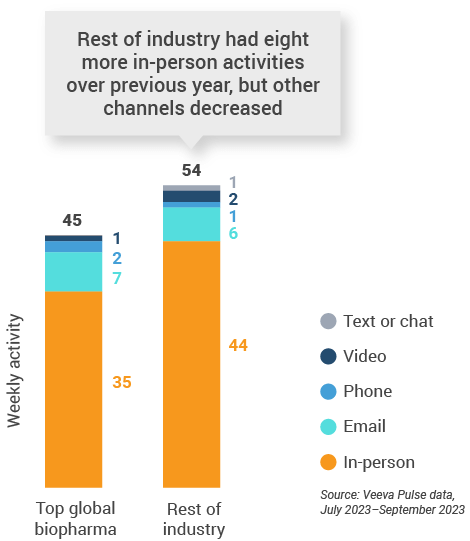
Figure 2: Channel mix, global
Global field team activity
Weekly activity per user by engagement channel
Figure 3: Activity by region, global
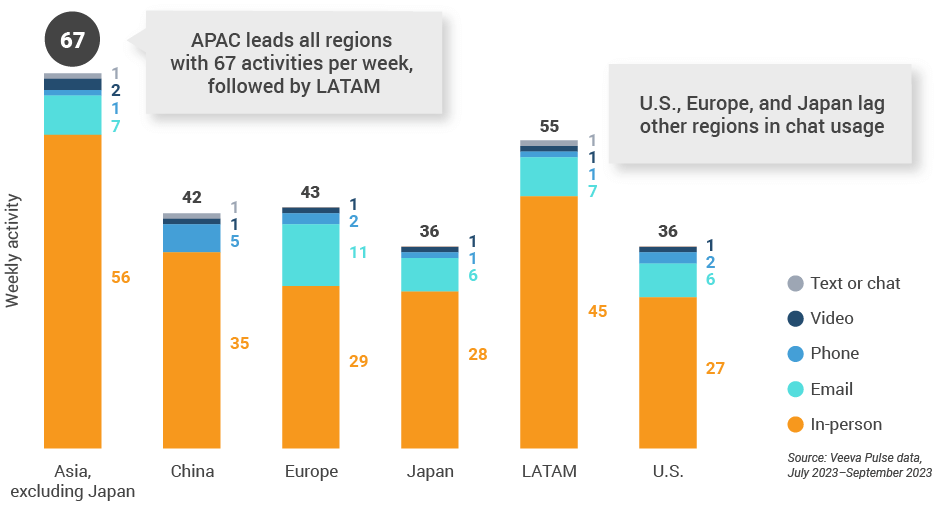
Figure 4: Activity by user type, global
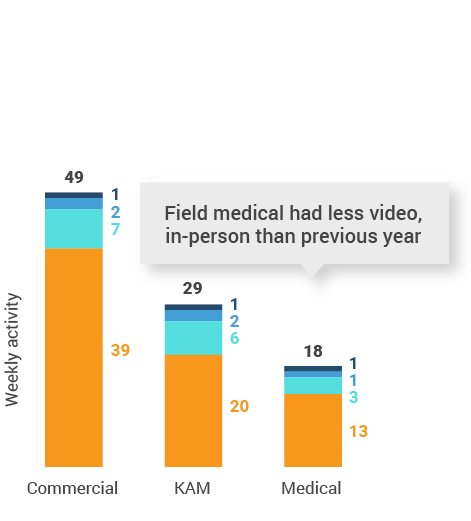
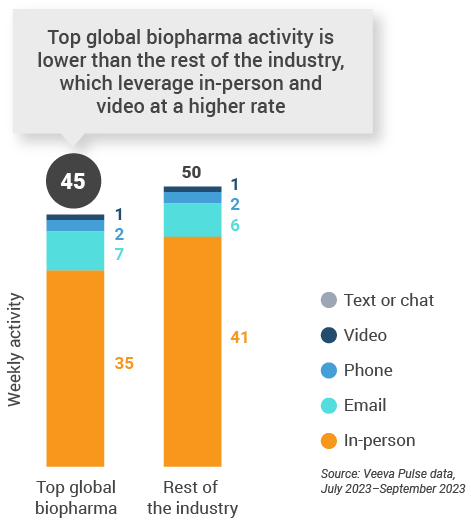
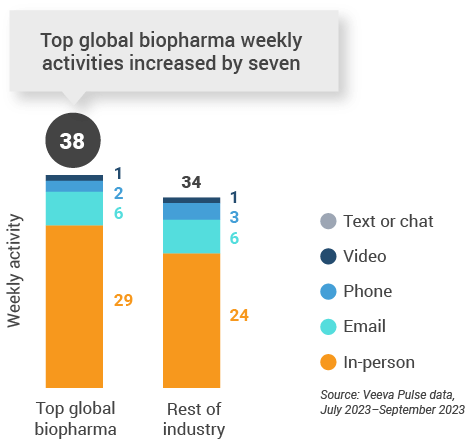
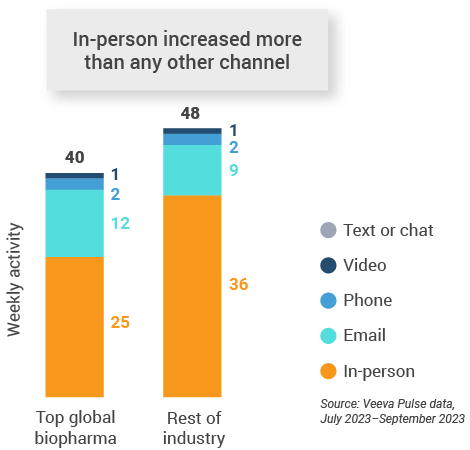
Figure 5: Activity by company size, global
Global engagement quality
Consolidation of key quality metrics
Figure 6: Approved email volume, global
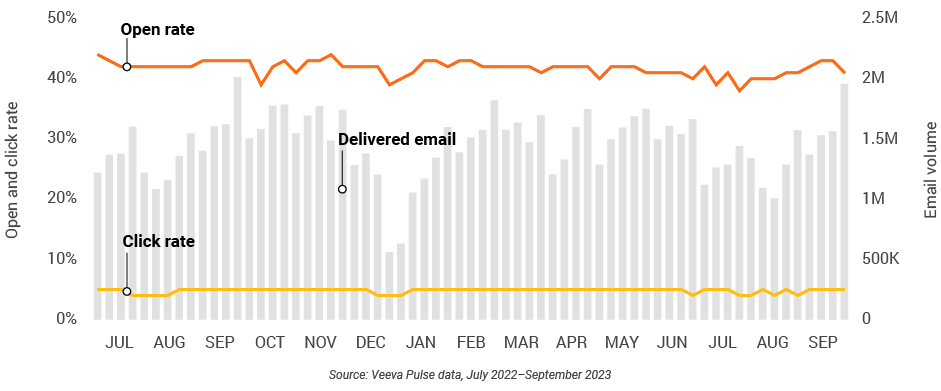
Figure 7: Content usage by channel, global
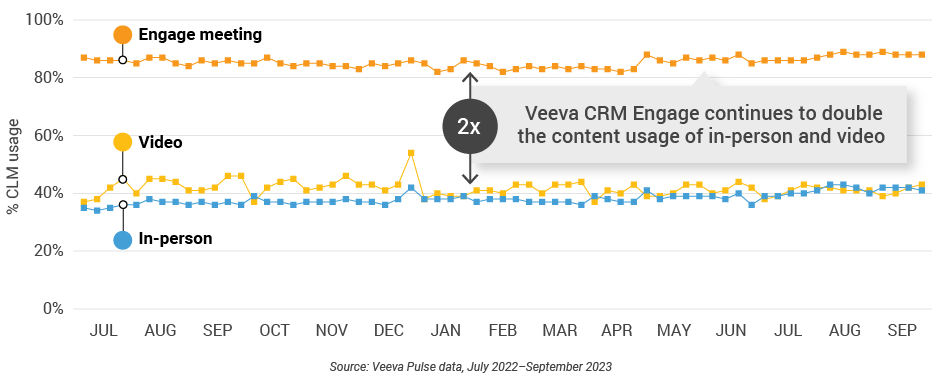
Figure 8: Veeva CRM Engage meeting duration, global

U.S. market trends
Figure 9: Channel mix evolution, U.S.
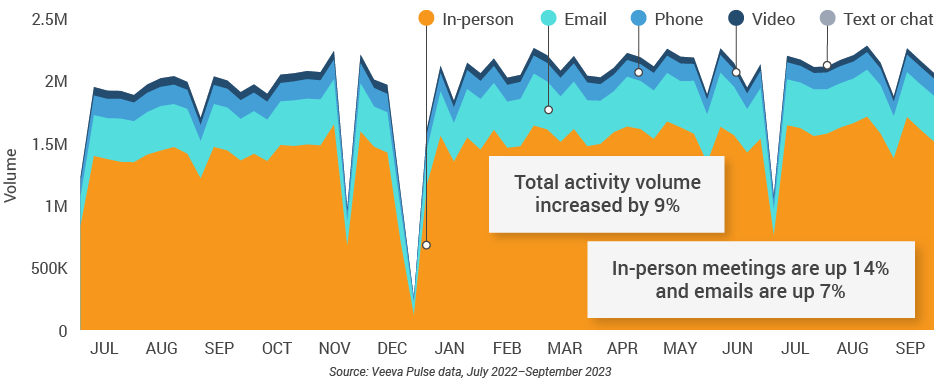
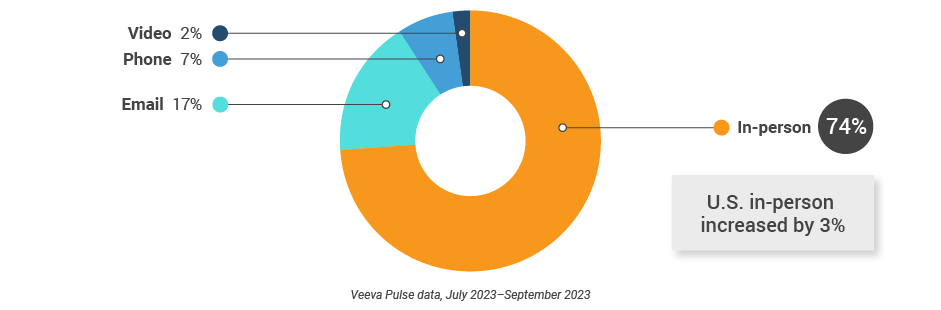
Figure 10: Channel mix, U.S.
U.S. field team activity
Weekly activity per user by engagement channel
Figure 11: Activity, U.S.
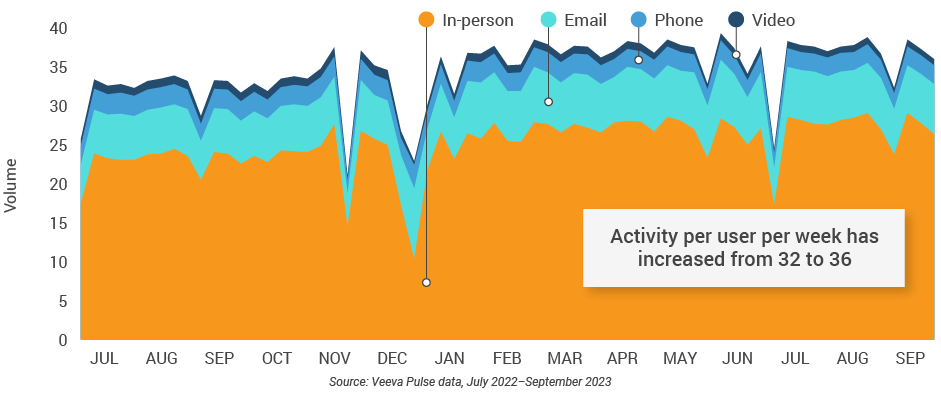
Figure 12: Activity by user type, U.S..
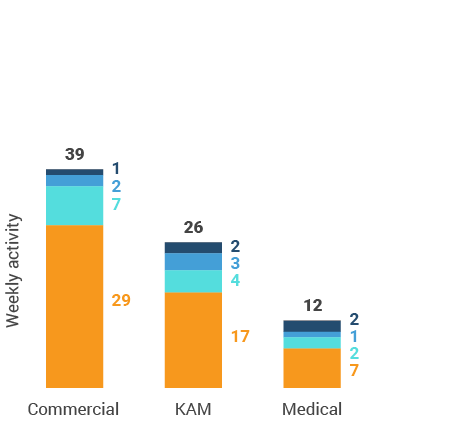
Figure 13: Activity by company size, U.S.
U.S. engagement quality
Consolidation of key quality metrics
Figure 14: Approved email volume, U.S.
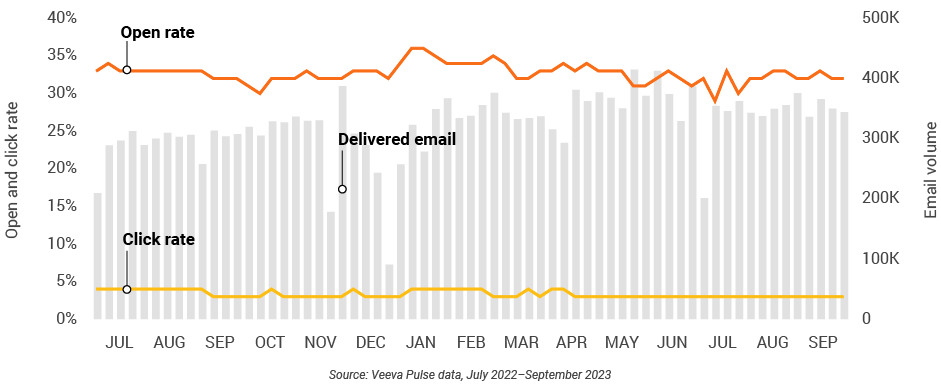
Figure 15: Content usage by channel, U.S.
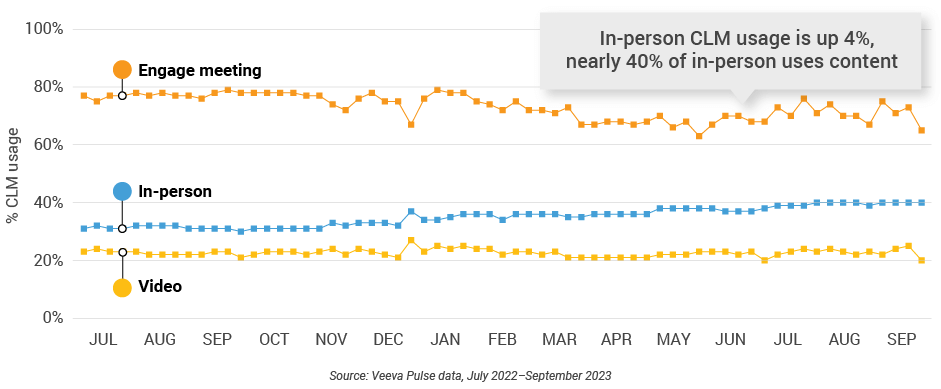
Figure 16: Veeva CRM Engage meeting duration, U.S.

Europe market trends
Figure 17: Channel mix evolution, Europe
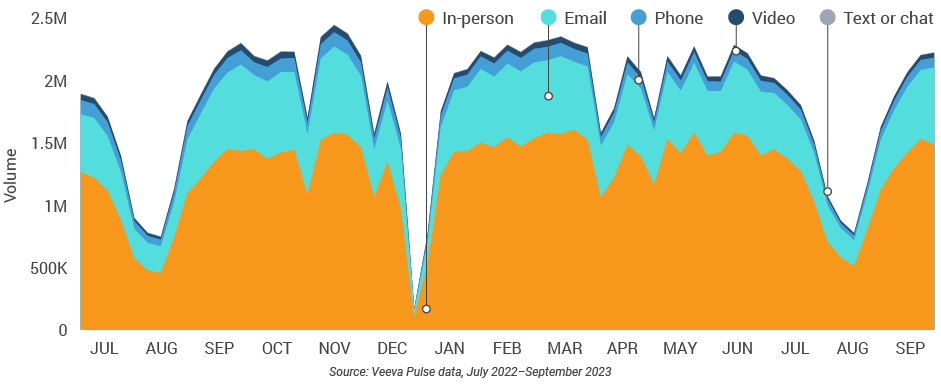
Figure 18: Channel mix, Europe
Europe field team activity
Weekly activity per user by engagement channel
Figure 19: Activity by country, EU5
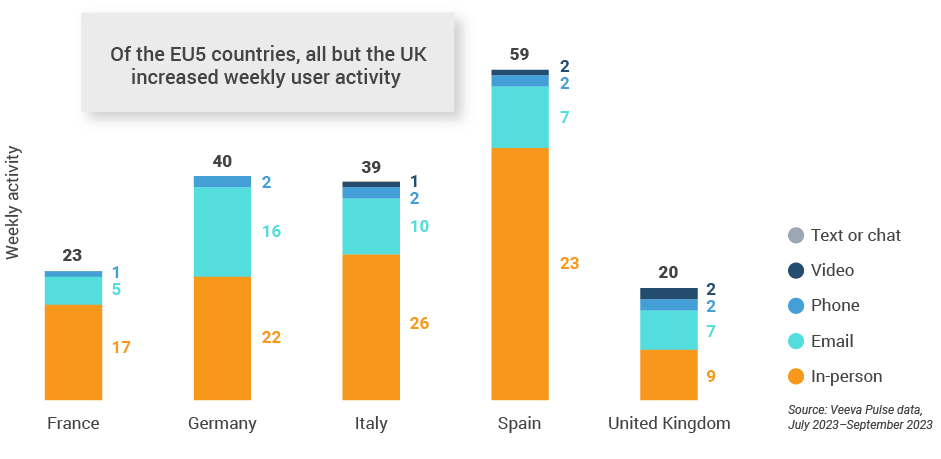
Figure 20: Activity by user type, Europe
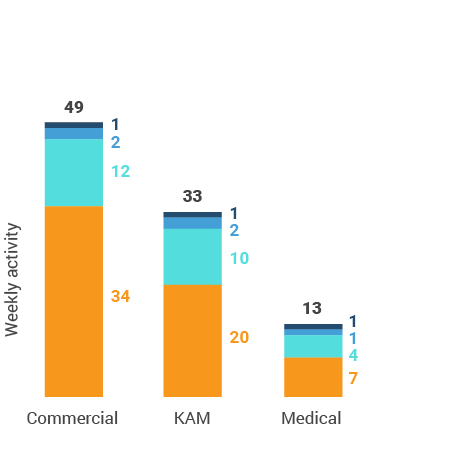
Figure 21: Activity by company size, Europe
Europe engagement quality
Consolidation of key quality metrics
Figure 22: Approved email volume, Europe
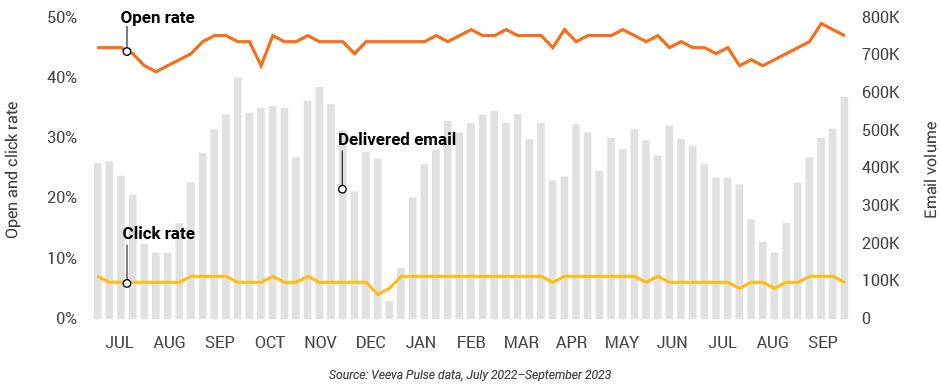
Figure 23: Content usage by channel, Europe
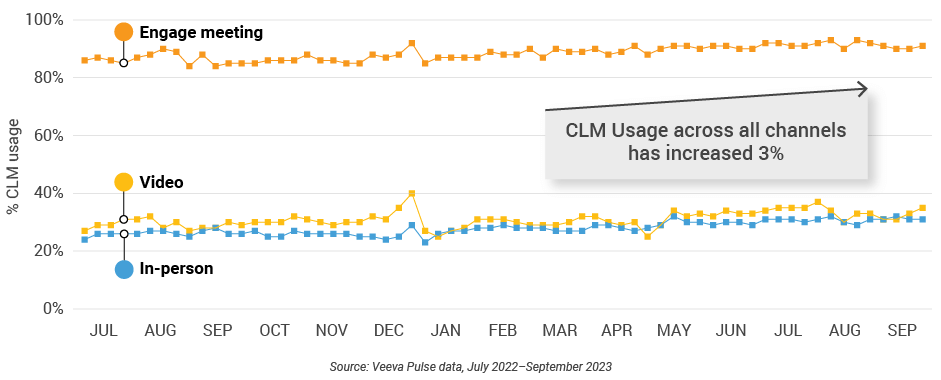
Figure 24: Veeva CRM Engage meeting duration, Europe

Asia market trends
Figure 25: Channel mix evolution, Asia
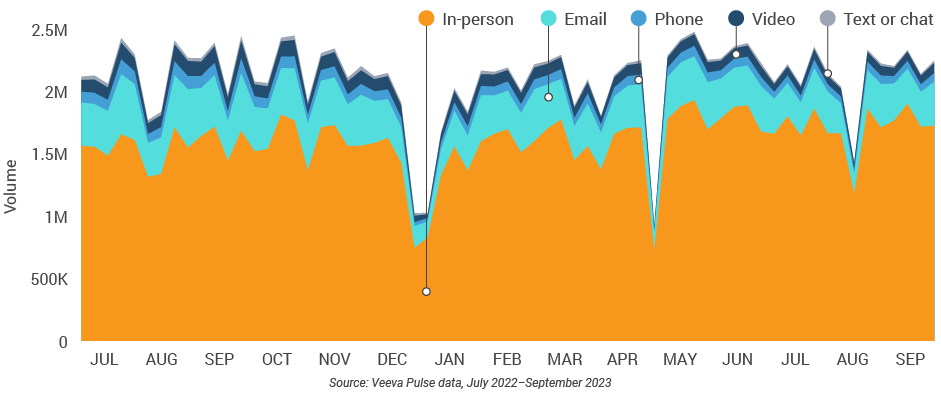
Figure 26: Channel mix, Asia
Asia field team activity
Weekly activity per user by engagement channel
Figure 27: Activity by country, Asia
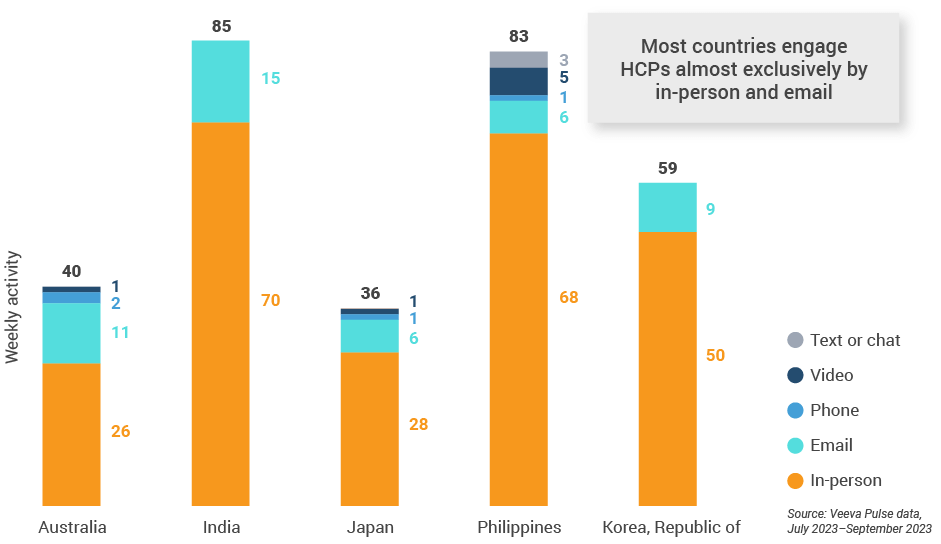
Figure 28: Activity by user type, Asia
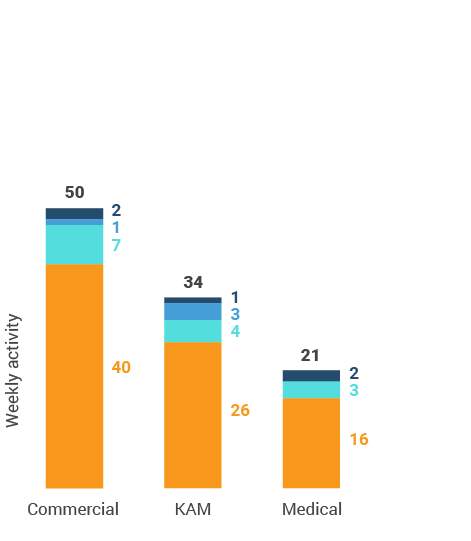
Figure 29: Activity by company size, Asia
Asia engagement quality
Consolidation of key quality metrics
Figure 30: Approved email volume, Asia
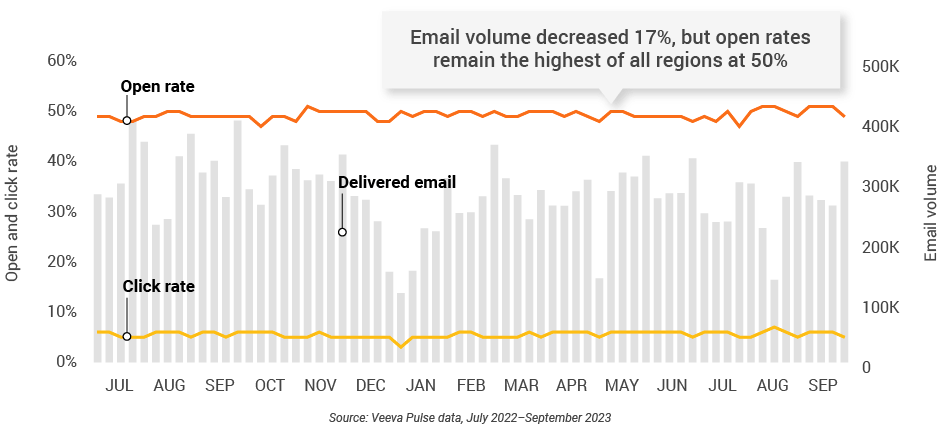
Figure 31: Content usage by channel, Asia
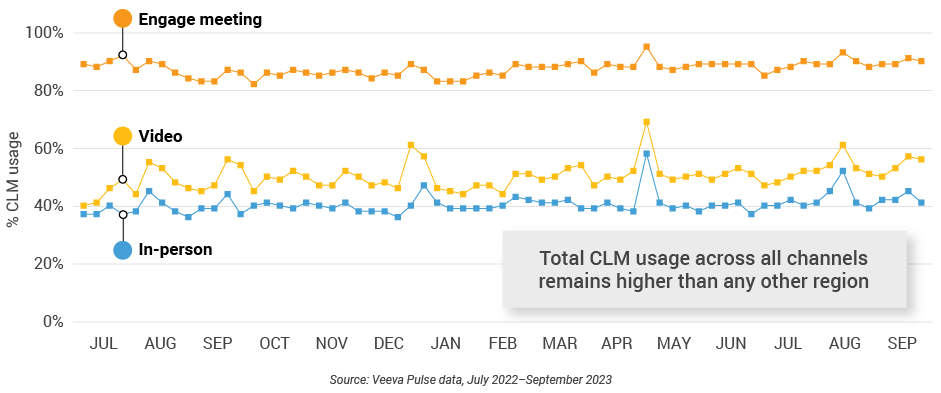
Figure 32: Veeva CRM Engage meeting duration, Asia

Latin America market trends
Figure 33: Channel mix evolution, Latin America
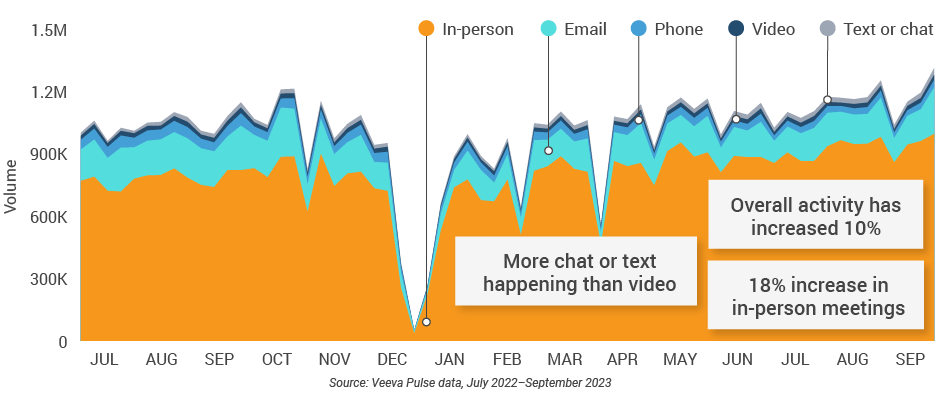
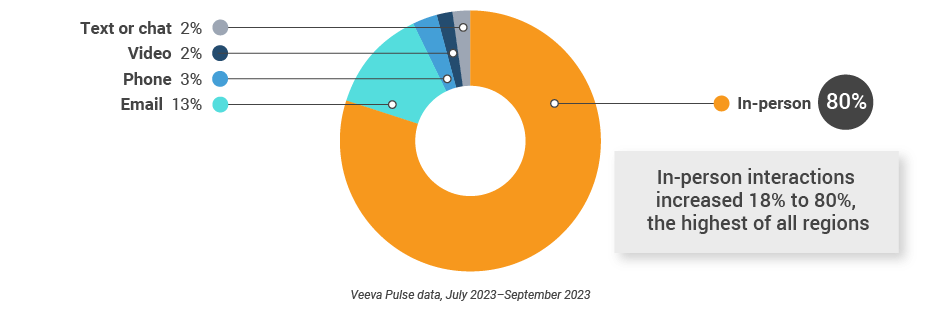
Figure 34: Channel mix, Latin America
Latin America field team activity
Weekly activity per user by engagement channel
Figure 35: Activity by country, Latin America
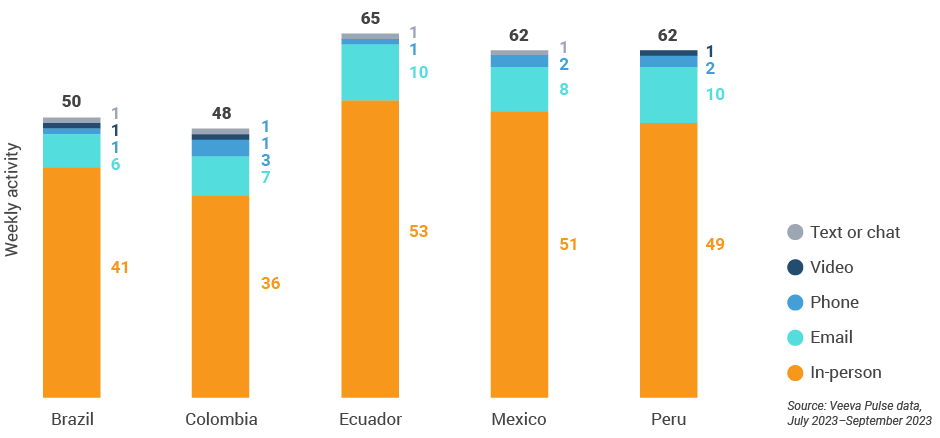
Figure 36: Activity by user type, Latin America
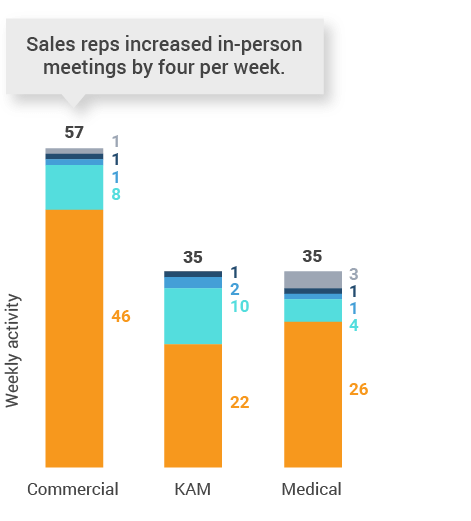
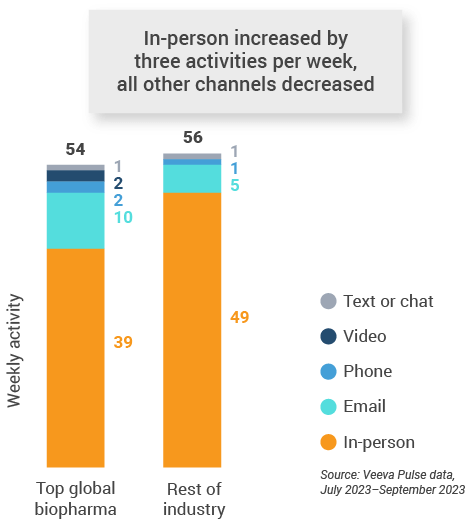
Figure 37: Activity by company size, Latin America
Latin America engagement quality
Consolidation of key quality metrics
Figure 38: Approved email volume, Latin America
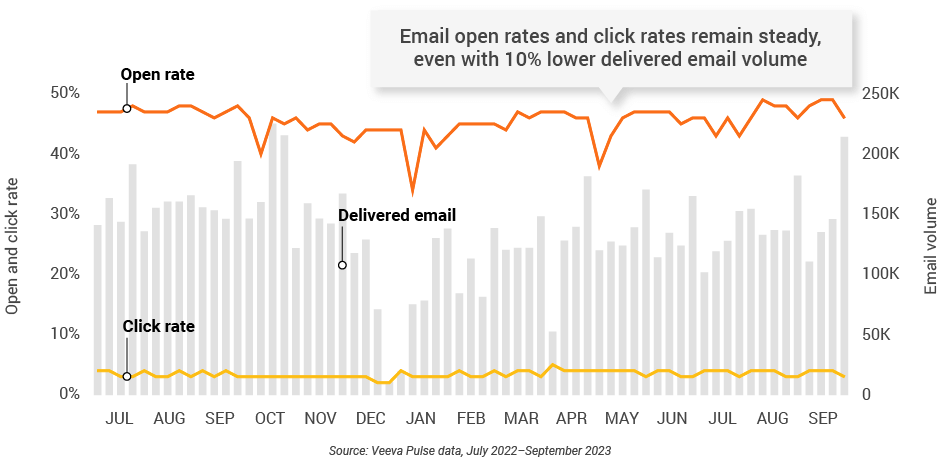
Figure 39: Content usage by channel, Latin America
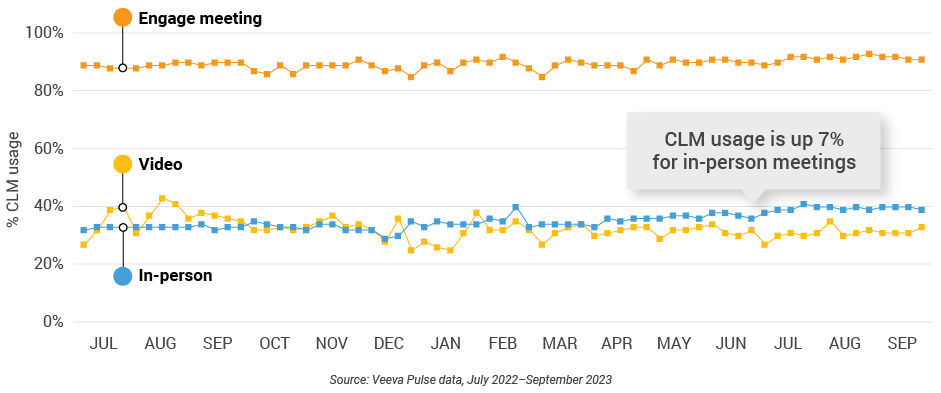
Figure 40: Veeva CRM Engage meeting duration, Latin America

Appendix: Data dictionary
Metric definitions
- Channel mix evolution over time: Weekly Veeva CRM activity volume broken down by the channel of engagement (in-person, phone, video, email, chat, or text)
- Channel mix: Total Veeva CRM activity volume broken down by engagement channel percentage
- Weekly activities per user: The average weekly number of Veeva CRM activities submitted per number of users active in Veeva CRM
- Approved email volume: Volume of approved emails sent via Veeva CRM
- Email open rate: Percentage of approved emails opened at least once out of all approved emails sent via Veeva CRM
- Email click rate: Percentage of approved emails clicked at least once out of all approved emails sent via Veeva CRM
- In-person % CLM usage: Percentage of in-person engagements that leveraged content in Veeva CRM
- Video % CLM usage: Percentage of video engagements that leveraged content in Veeva CRM
- Veeva CRM Engage meeting % CLM usage: Percentage of Veeva CRM Engage meetings that leveraged content in Veeva CRM
- Veeva CRM Engage meeting duration: The average duration of Veeva CRM Engage meetings in minutes
Engagement channel definitions
- In-person: Submitted calls with a CRM Standard Metrics call channel value of ‘in-person’
- Phone: Submitted calls with a CRM Standard Metrics call channel value of ‘phone’
- Video: Veeva CRM Engage calls and video calls via other platforms that are then recorded as calls in Veeva CRM with a Standard Metrics call channel value of ‘video’
- Email: Approved emails and emails sent via other platforms that are then recorded as calls in Veeva CRM with a Standard Metrics call channel value of ‘email’
- Chat or text: Submitted calls with a CRM Standard Metrics call channel value of ‘chat or text’
User type definitions
- Sales: Users that have been classified with the ‘sales’ value in the CRM Standard Metrics user type field
- Key account manager: Users that have been classified with the ‘key account manager’ value in the CRM Standard Metrics user type field
- Medical: Users that have been classified with the ‘medical’ value in the CRM Standard Metrics user type field
- Top global biopharma: Top 17 global biopharma companies by revenue
- Rest of industry: All other biopharmas
Region definitions
- Global: All markets globally
- Europe: Albania, Andorra, Armenia, Aruba, Austria, Azerbaijan, Belarus, Belgium, Bermuda, Bosnia and Herzegovina,
Bulgaria, Croatia, Cyprus, Czech Republic, Denmark, Estonia, Finland, France, French Polynesia, Georgia, Germany,
Greece, Greenland, Guadeloupe, Guernsey, Hungary, Ireland, Italy, Jersey, Latvia, Lithuania, Luxembourg, Macedonia,
Malta, Martinique, Republic of Moldova, Monaco, Montenegro, Netherlands, New Caledonia, Norway, Poland, Portugal,
Romania, Serbia, Slovakia, Slovenia, Spain, Sweden, Switzerland, Ukraine, United Kingdom - Asia: Australia, Bangladesh, Bhutan, Brunei Darussalam, Cambodia, Cocos (Keeling) Islands, Indonesia, Japan, Kazakhstan, Republic of Korea, Kyrgyzstan, Malaysia, Mongolia, Myanmar, Nauru, Nepal, New Zealand, Philippines, Samoa, Singapore, Solomon Islands, Sri Lanka, Taiwan, Tajikistan, Thailand, Turkmenistan, Uzbekistan, Vietnam
- Latin America: Antigua and Barbuda, Argentina, Bahamas, Barbados, Belize, Bolivia, Brazil, Chile, Colombia, Costa Rica, Cuba, Dominican Republic, Ecuador, El Salvador, Guatemala, Guyana, Haiti, Honduras, Jamaica, Mexico, Nicaragua, Panama, Paraguay, Peru, Trinidad and Tobago, Uruguay, Venezuela
Methodology
The Veeva Pulse Field Trends Report is a quarterly industry benchmark for global and regional healthcare professional
(HCP) engagement across the life sciences industry. The report is based on proprietary Veeva Pulse data and insights
from field engagement activities of more than 80% of all industry representatives worldwide (Asia Pacific, Europe, Latin
America, and the United States). Veeva CRM Standard Metrics — now used industrywide — provides the basis for
consistent collection and measurement of engagement KPIs including channel mix and productivity across regions,
roles, and market segments. The findings are based on approximately 600 million annual global field activities captured
in Veeva CRM and Veeva CRM Engage.
The Veeva Pulse Field Trends Report delivers insights that inform the industry and help field teams align their strategy to
key market trends for improved commercial success. The global Veeva Business Consulting team also helps customers
inform their strategies using industry benchmarking with Veeva Pulse data.