3 Ways Biopharmas Are Using Field Insights to Better Engage HCPs
Healthcare professionals (HCPs) put a premium on interactions with field teams who get them what they need, quickly and reliably. But, only 27% of HCPs say that biopharmas communicate with them in a relevant and personalized way, according to data from the Digital Health Coalition.
The Veeva Pulse Field Trends Report is addressing this disconnect by revealing untapped insights into HCP
engagement based on an analysis of 600 million HCP interactions across more than 80% of biopharmas worldwide.
Now, biopharma field teams are turning these insights1 into action:
- Kyowa Kirin is closing the gap between content creation and field use, as new patient starts are 2.5 times more likely when reps share digital content in meetings with HCPs
- Lundbeck is using real-time intelligence to target KOLs, as treatment adoption improves by 1.5 times when field medical provides early disease-state education
- Boehringer Ingelheim is strengthening the rep-HCP relationship with compliant chat, which more than doubles digital engagement, keeping in-person the same or better
Empowering field teams with the right content, the right engagement opportunities, and the right channels builds strong customer relationships that create lasting value for HCPs and patients.
Read Veeva Business Consulting’s in-depth analysis to learn how these industry leaders are combining data and
technology to engage HCPs more effectively.
Thank you,

Dan Rizzo
Global Head of Veeva Business Consulting

1 Bolded insights are from Veeva Pulse data and not specific to mentioned biopharmas.
1. Maximize digital content adoption with your field team
When sales reps use digital content during HCP calls, it drives 2.5 times more new patient
starts than meetings that don’t use content, according to Veeva Pulse data. But, field teams
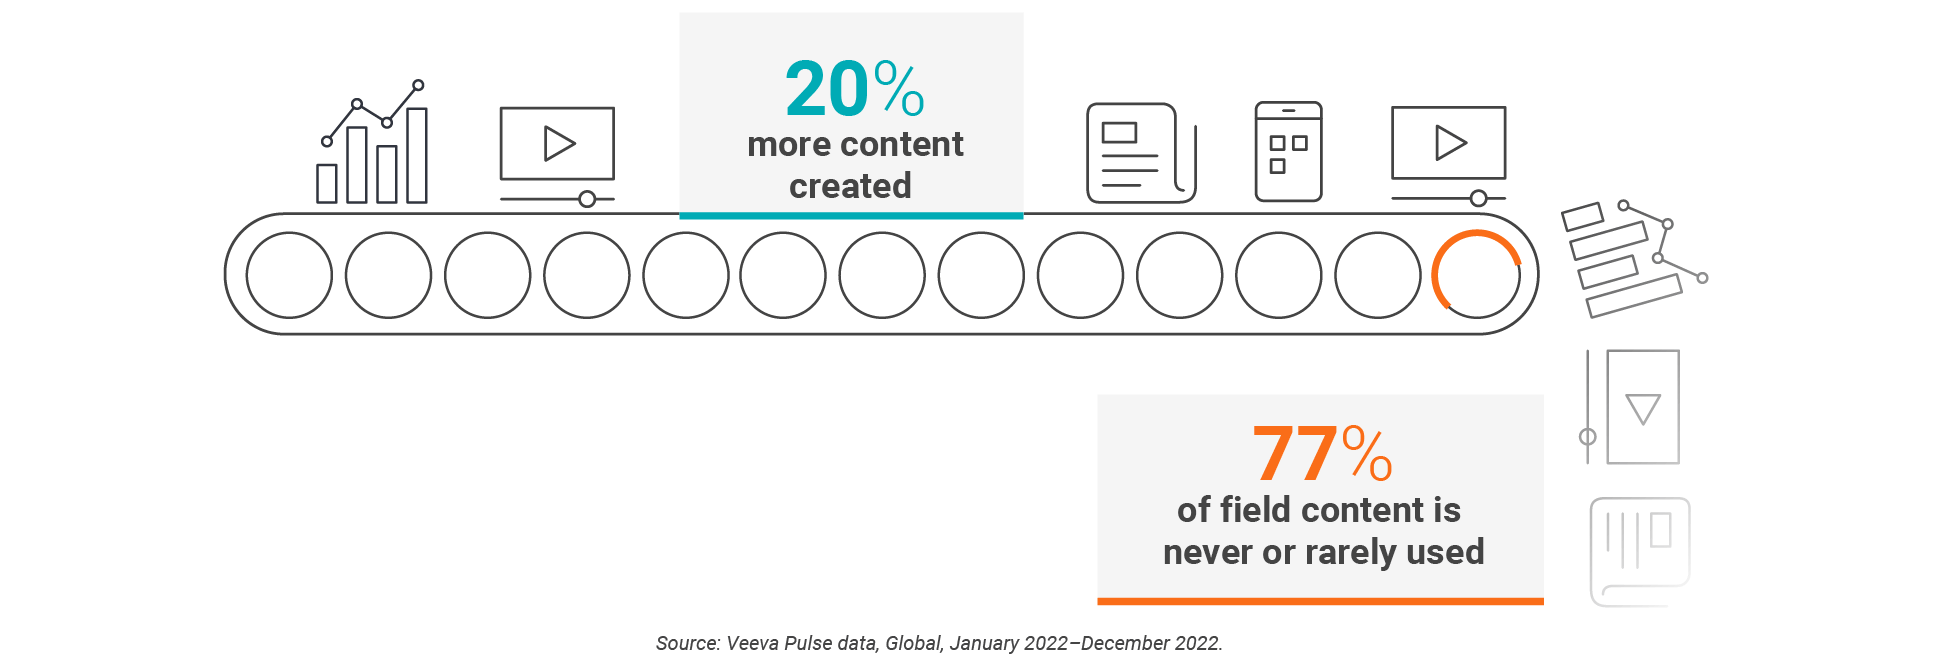
don’t share digital content in six out of 10 meetings. And, even though companies created 20%
more content last year, field teams used less than a quarter of it.
keys to an effective
content strategy

Jay McMeekan, senior director of the commercial
digital center of excellence at Kyowa Kirin, a Japan-based
specialty pharmaceutical company, believes that
field input into the process can bridge the gap between
content creation and content use.

Bring the field team in early to help you figure out what works and what doesn’t. Not only is it efficient, your content is more effective. They aren’t using the content because they were told to, but because they helped create it.”
–Jay McMeekan
Senior Director of the Commercial Digital Center of
Excellence, Kyowa Kirin
Kyowa Kirin’s team limits decks
to 10 slides, so reps
can identify the content they
need quickly.
Multiple versions of similar content makes it difficult for reps to know what assets
to use.
Early in the process, make sure you understand how reps
will use the content in front of the customer.
2. Improve treatment adoption with early KOL engagement
Early disease state education by field medical with key opinion leaders (KOLs) is associated
with 1.5 times greater treatment adoption across that healthcare organization over the first six
months post-launch, a Veeva data analysis shows. But, because of outdated KOL selection and
prioritization methods, 70% of KOLs engage with only one biopharma field medical team, limiting
scientific engagement and the ability to accurately measure field medical impact.

data-driven approach
to KOL engagement

Christine Castro, director, medical affairs excellence at
Lundbeck, sees the value in a standard, data-driven
approach to identifying, prioritizing, and engaging KOLs.
Lundbeck is combining real-time customer intelligence
and CRM data to create a new engagement strategy.

The right data is foundational to our engagement
strategy. As we prepared for the launch of
new treatments, this data-driven approach helped us build
the right relationships and focus our resources where
they will have the greatest scientific impact.”
–Christine Castro
Director, Medical Affairs Excellence, Lundbeck
Start by identifying your
objectives. What are you
trying to achieve? What KPIs
will you measure?
Are you engaging with the
right KOLs? Challenge your
KOL selection with external
industry data.
What will your customers
get out of meeting with you?
Make sure they see the
value – and document it.
3. Empower reps to engage HCPs in their moment of need
While nothing can replace in-person interactions, adding an inbound engagement channel lets
HCPs raise their hand in their moment of need. When given a compliant chat channel, HCPs will
initiate conversations 30% of the time, and reps can respond with value and speed.

delivers a better
rep-HCP experience
Boehringer Ingelheim is putting this service-focused
model into practice, which more than doubles digital
touchpoints while keeping in-person volume the same
or better. This approach gives HCPs immediate access
to valuable resources without waiting for in-person
meetings.

Compliant chat allows reps to respond more quickly to
HCPs on a convenient platform, increasing access and
deepening relationships.”
–Jill Shoffner-Brown
Commercial Business Director, Boehringer Ingelheim
“I really think contact should be bidirectional – the right
channel should enable doctors to connect with reps, and
reps to connect with doctors.”
–Karin Fuchs, MD
OB-GYN, Veeva’s HCP Advisory Board
Customers can request patient
resources, content, samples,
and meetings in a compliant
way.
Field reps can easily make new
connections and respond
quickly between in-person
meetings.
For shared targets, partners
can increase collaboration
by engaging seamlessly on
one platform.
Reach out to Veeva Business Consulting to find out how you can use Veeva Pulse data to create a service-focused engagement model for your business.
Global and Regional Trends
This report highlights global and regional field engagement trends from Veeva Pulse data gathered between October
2022 and December 2023. Veeva Pulse data is sourced from Veeva’s aggregated CRM activity, inclusive of field
engagement stats from all instances of Veeva CRM globally. Unless otherwise noted, chart insights compare Q4 2023
to Q4 2022.
Global trends
Figure 1: Channel mix evolution, global
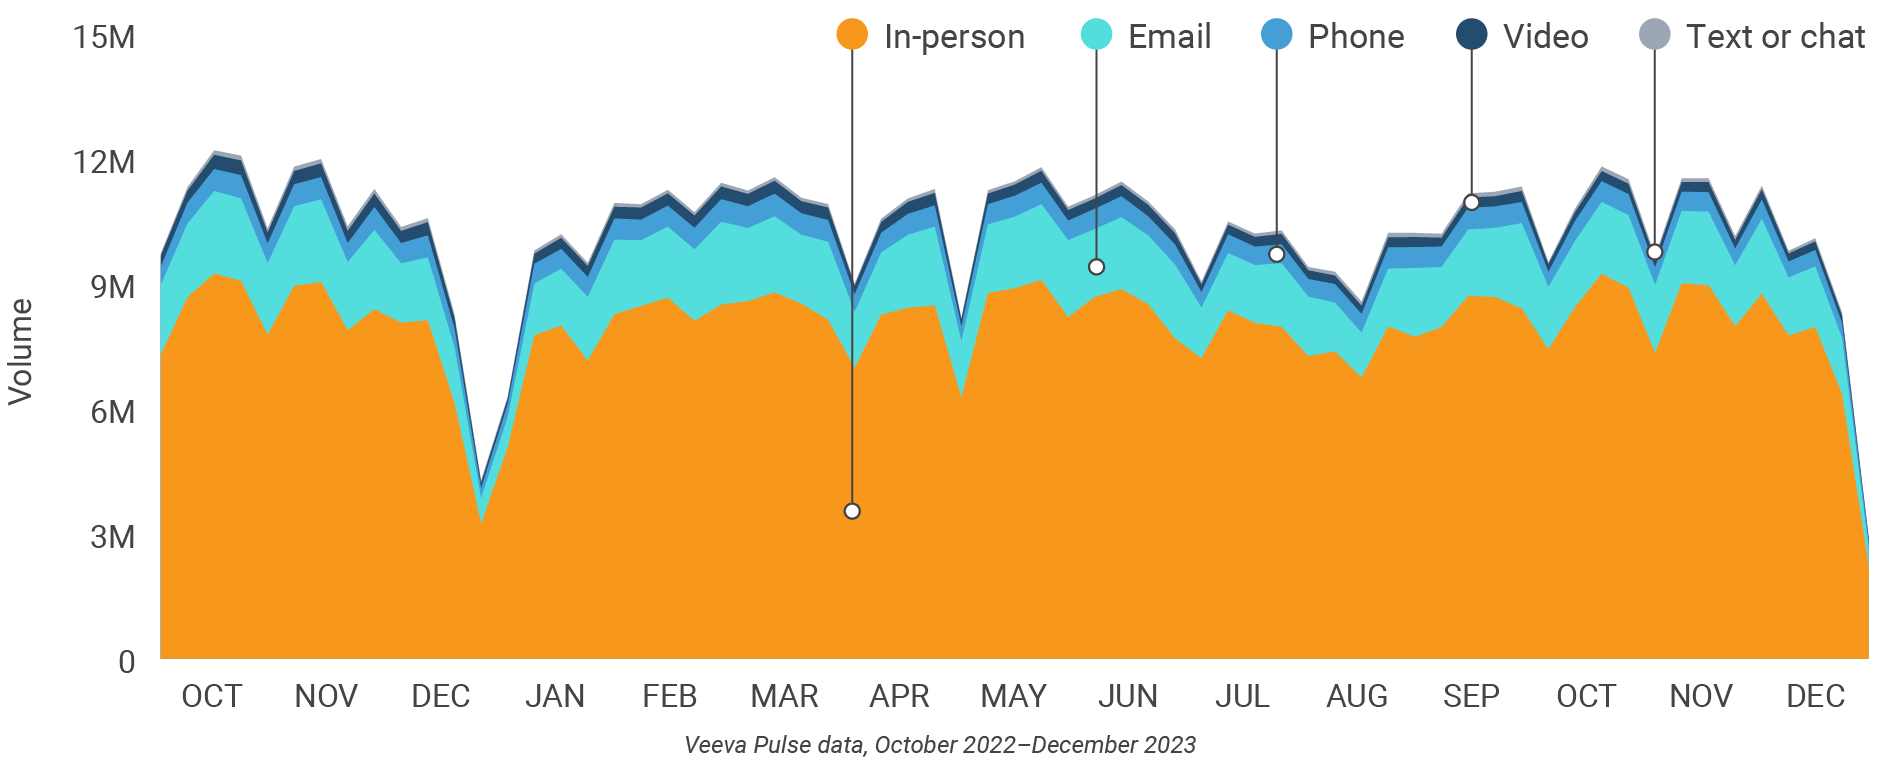
Figure 2: Channel mix, global

Global field team activity
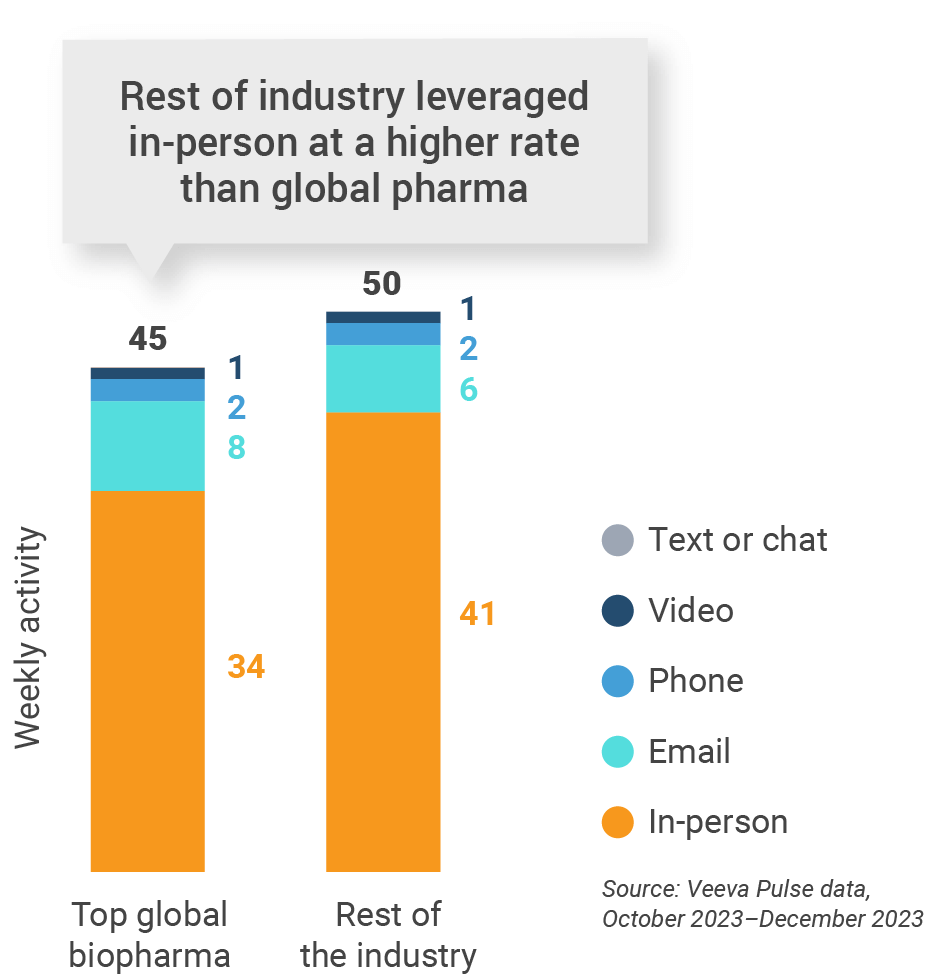
Weekly activity per user by engagement channel
Figure 3: Activity by region, global
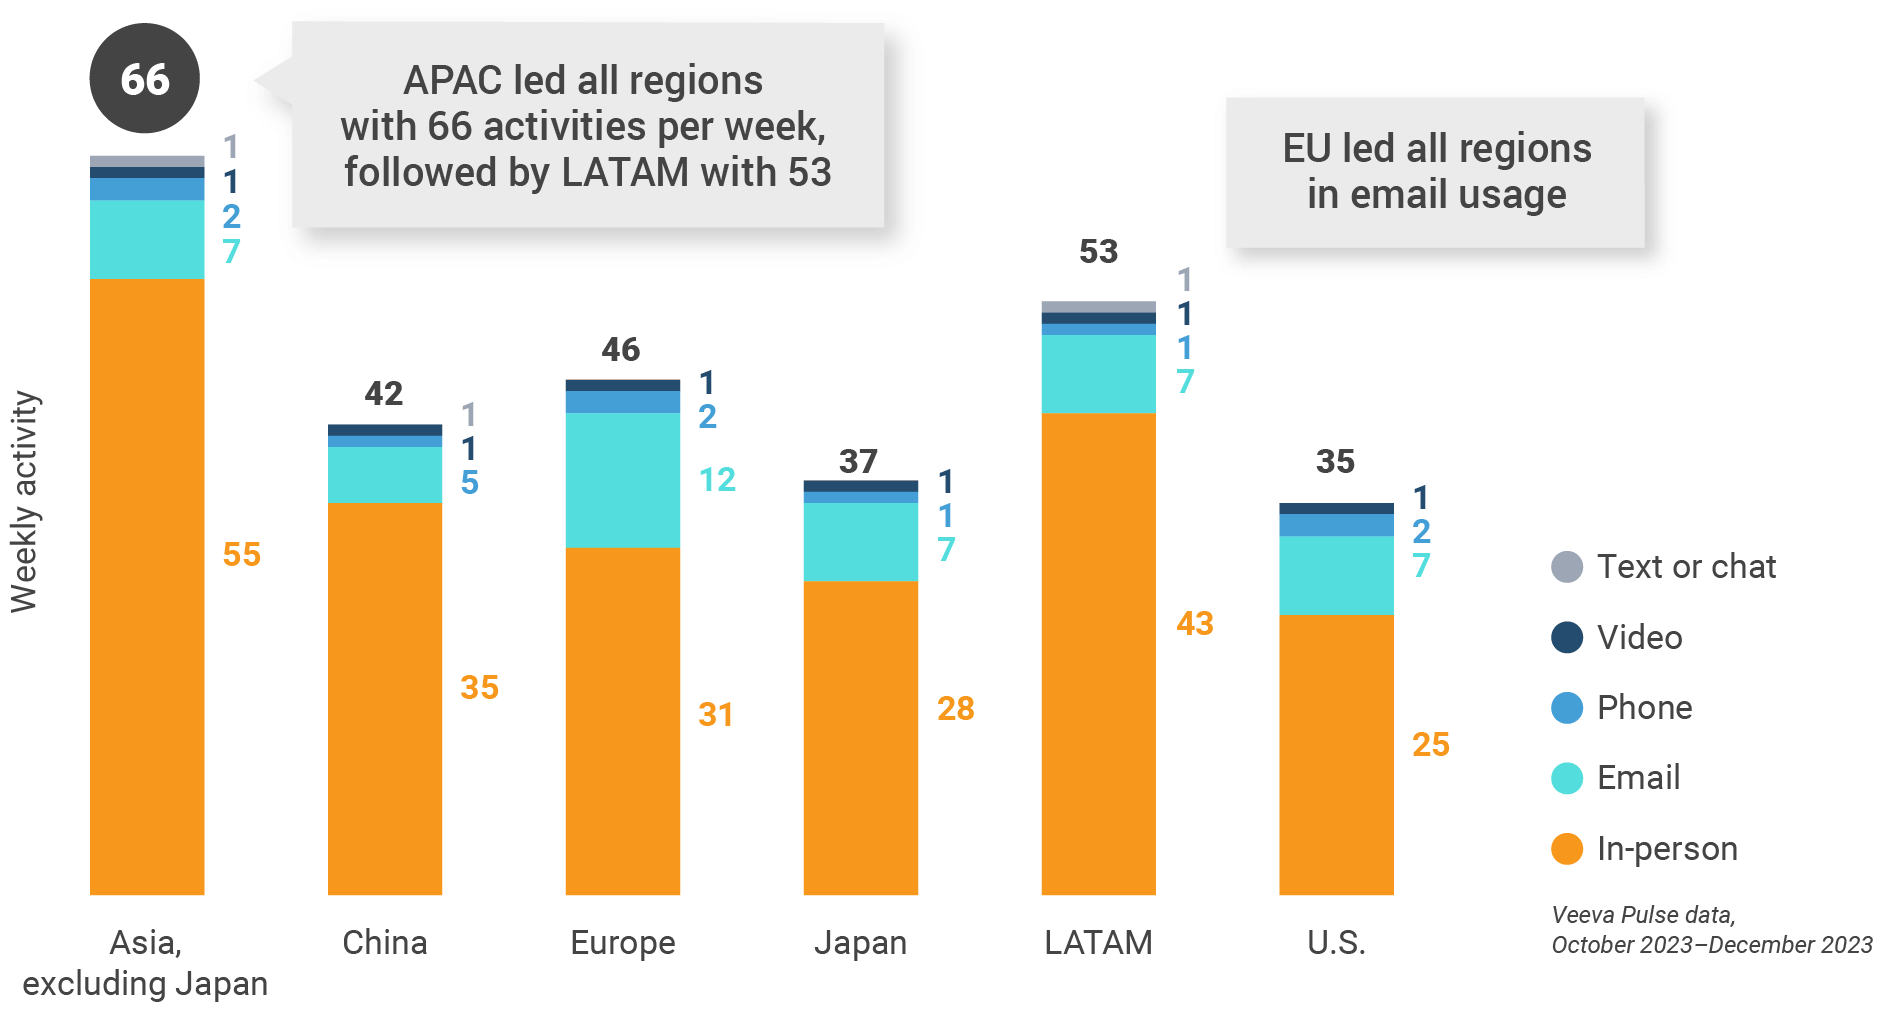
Figure 4: Activity by user type, global
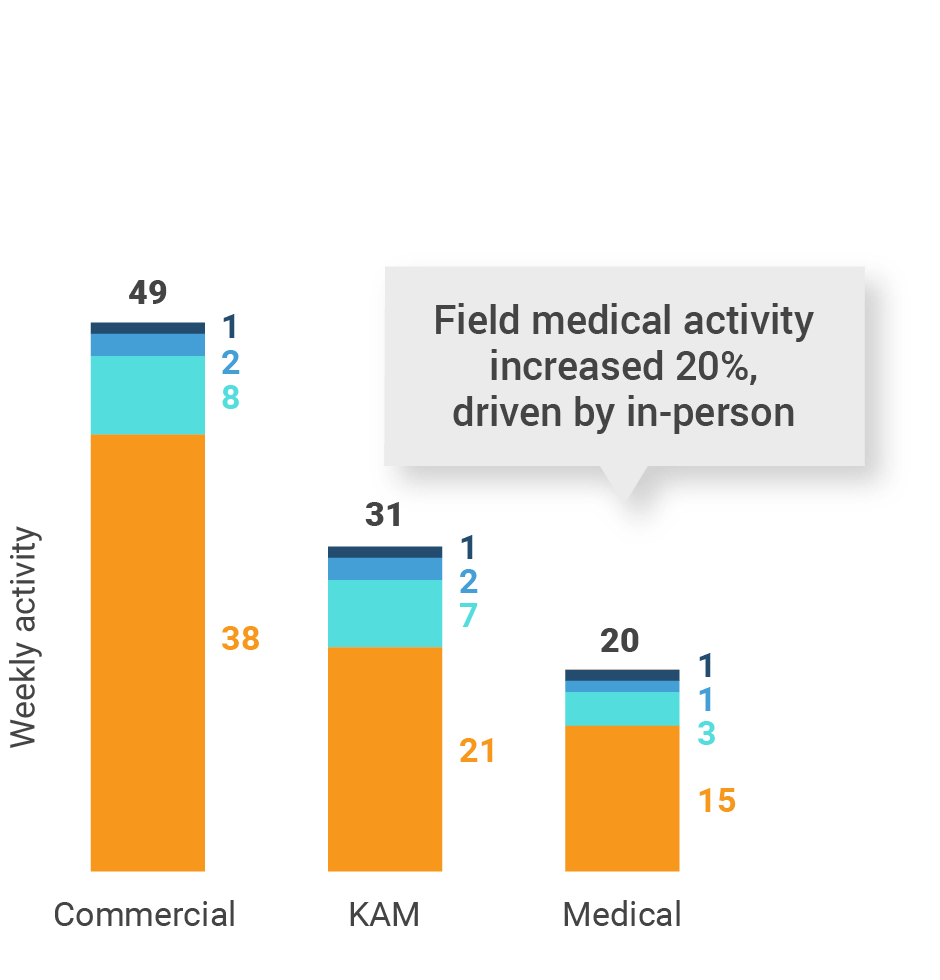
Figure 5: Activity by company size, global
Global engagement quality
Consolidation of key quality metrics
Figure 6: Approved email volume, global
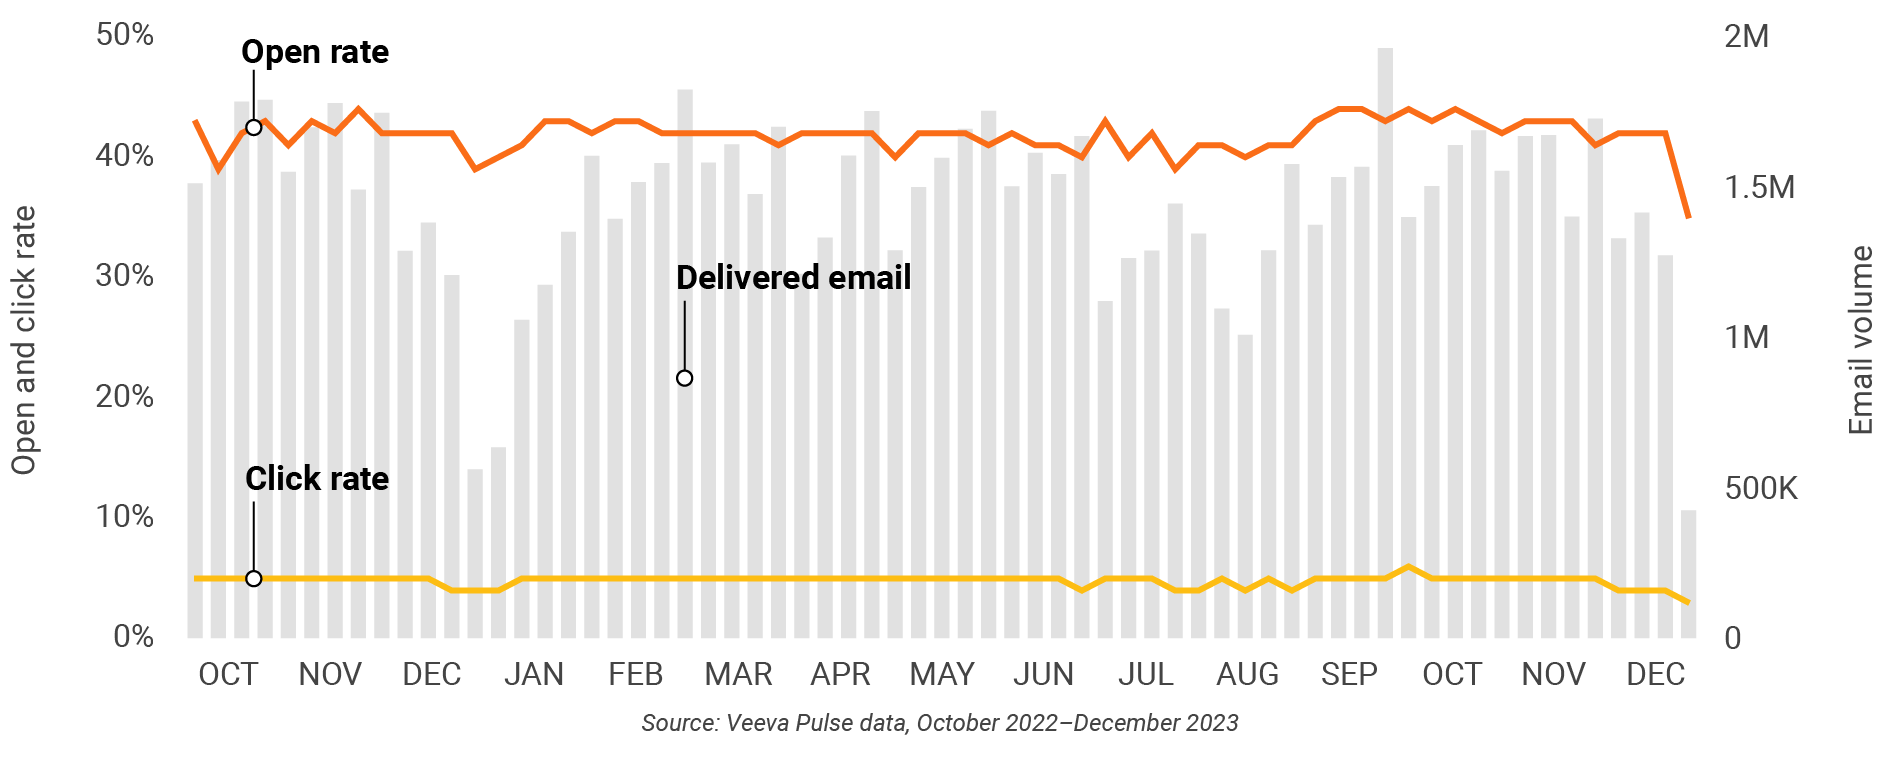
Figure 7: Content usage by channel, global
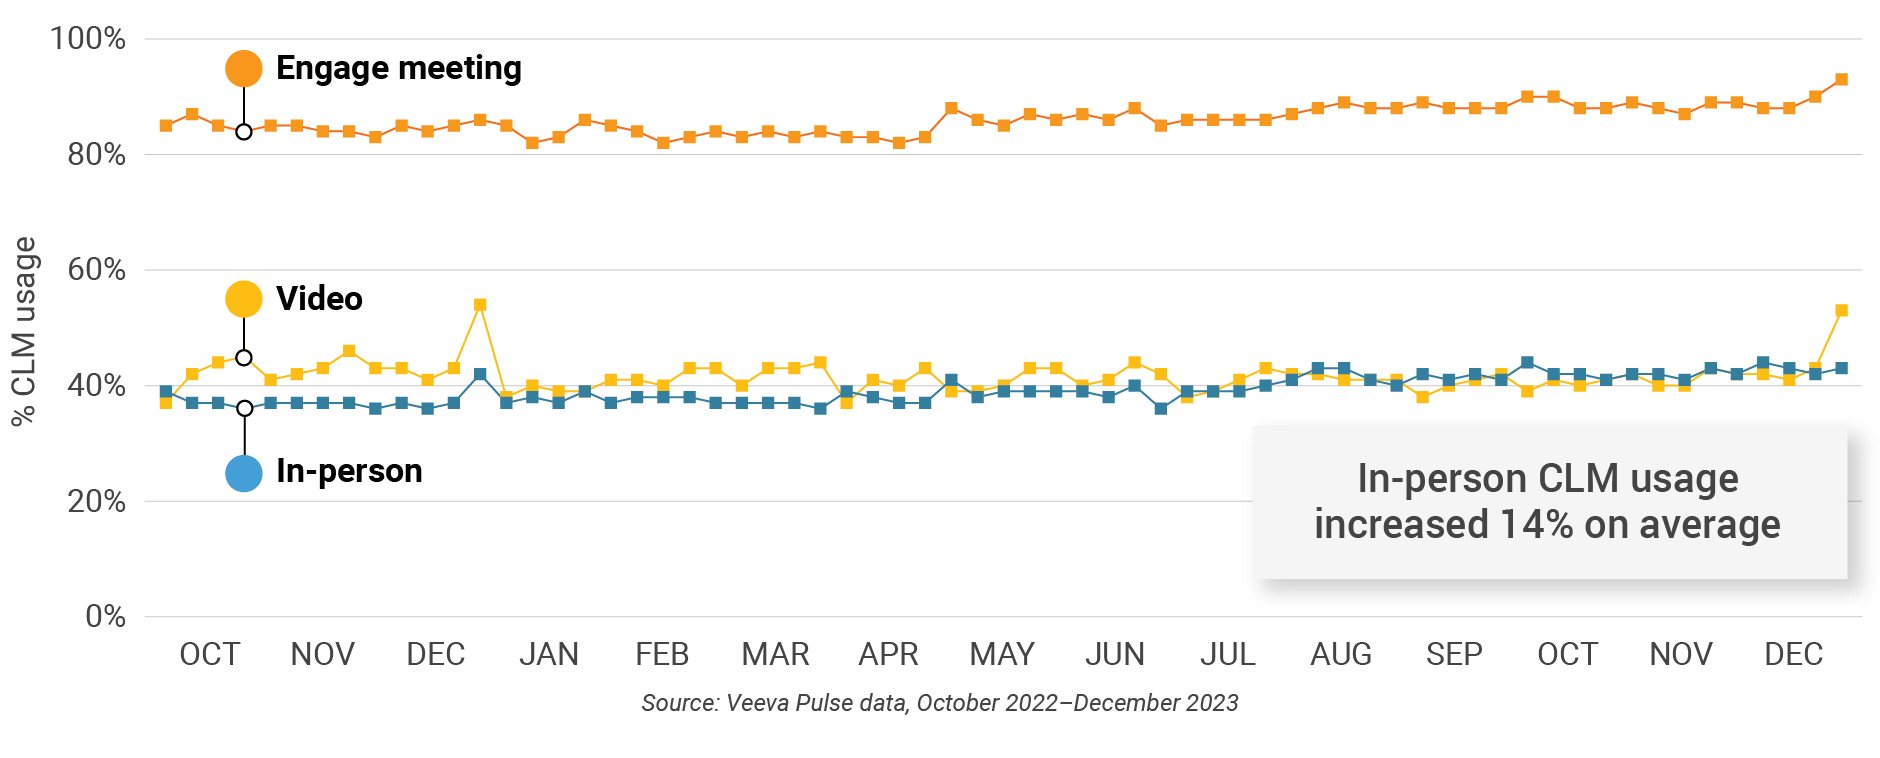
Figure 8: Veeva CRM Engage meeting duration, global

U.S. market trends
Figure 9: Channel mix evolution, U.S.
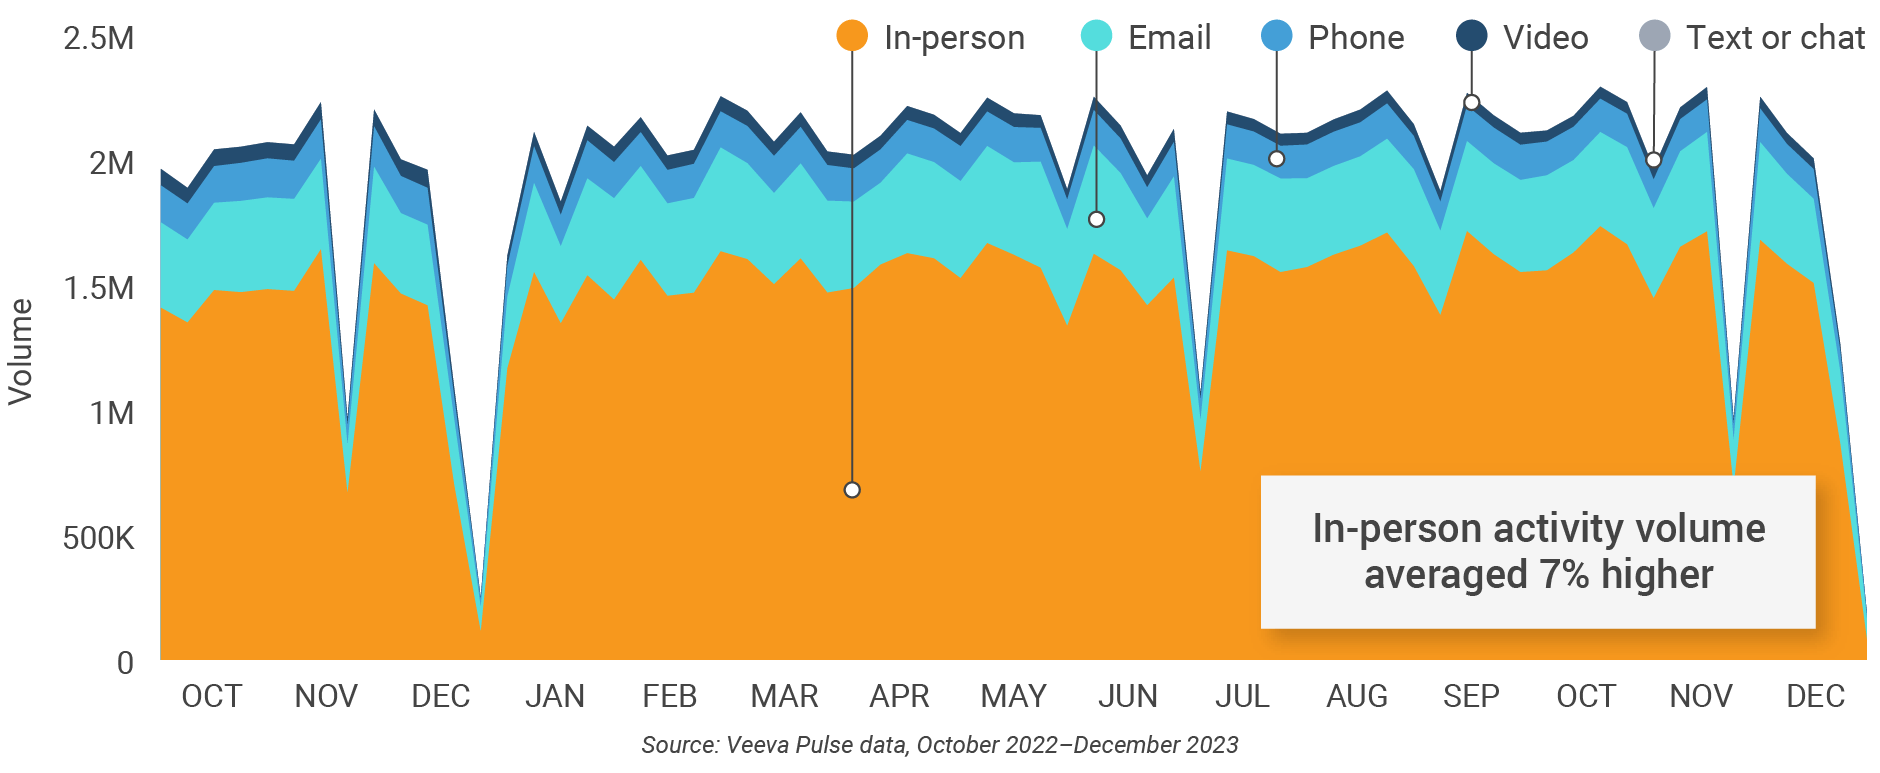
Figure 10: Channel mix, U.S.

U.S. field team activity
Weekly activity per user by engagement channel
Figure 11: Activity, U.S.
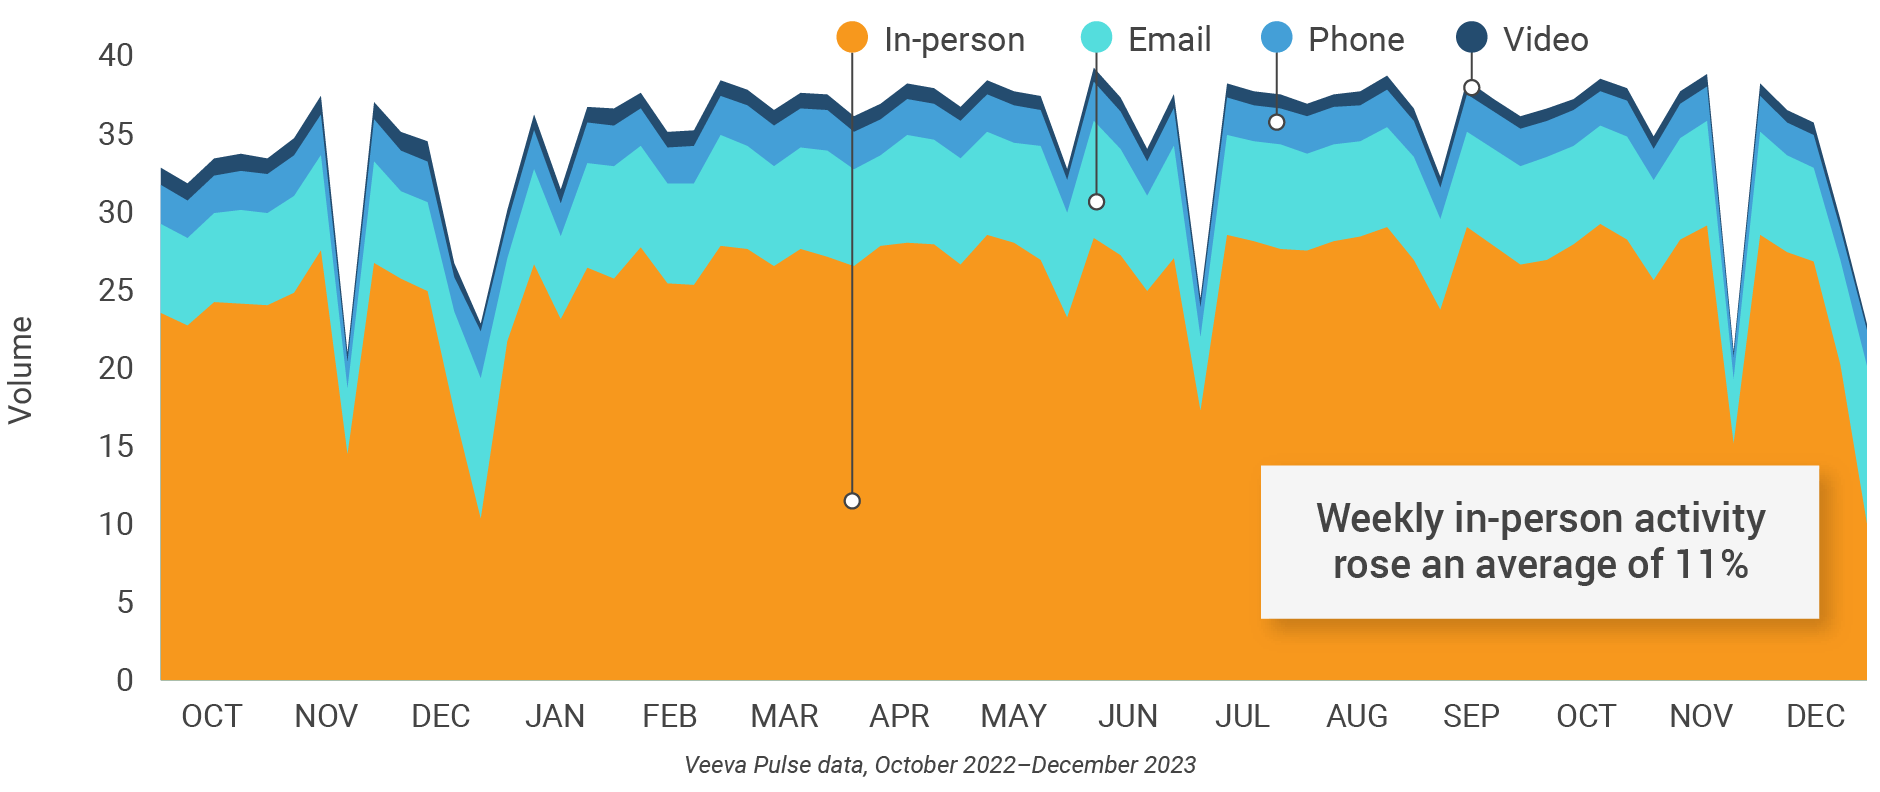
Figure 12: Activity by user type, U.S..
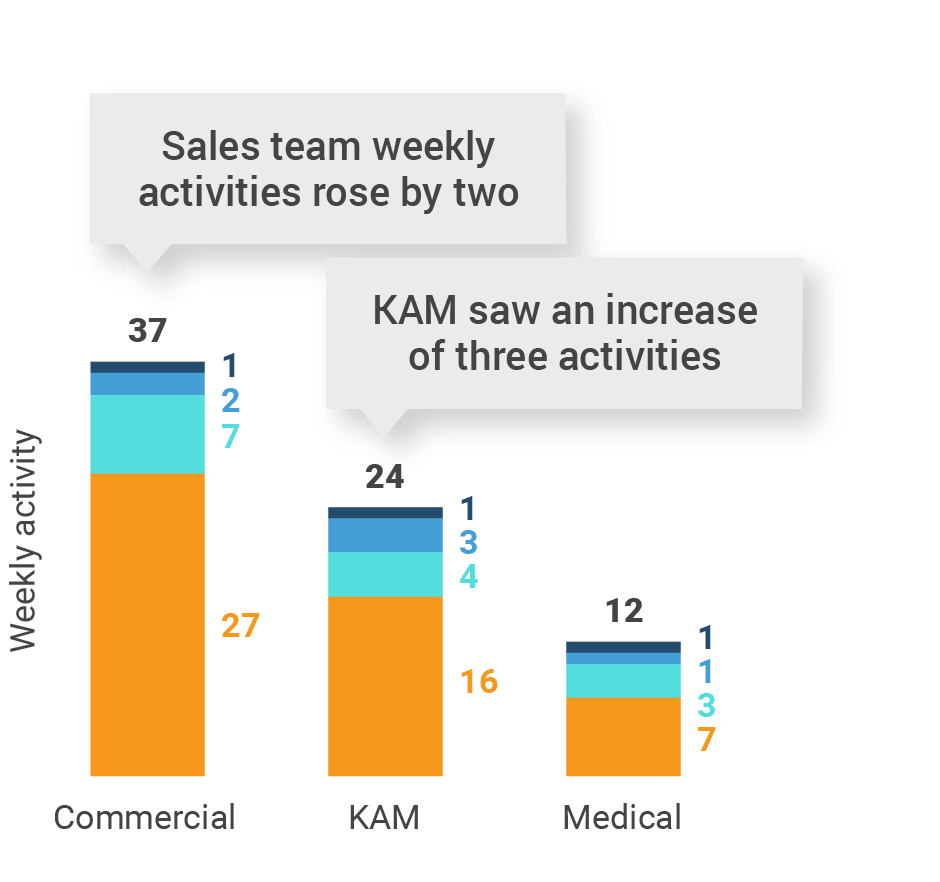
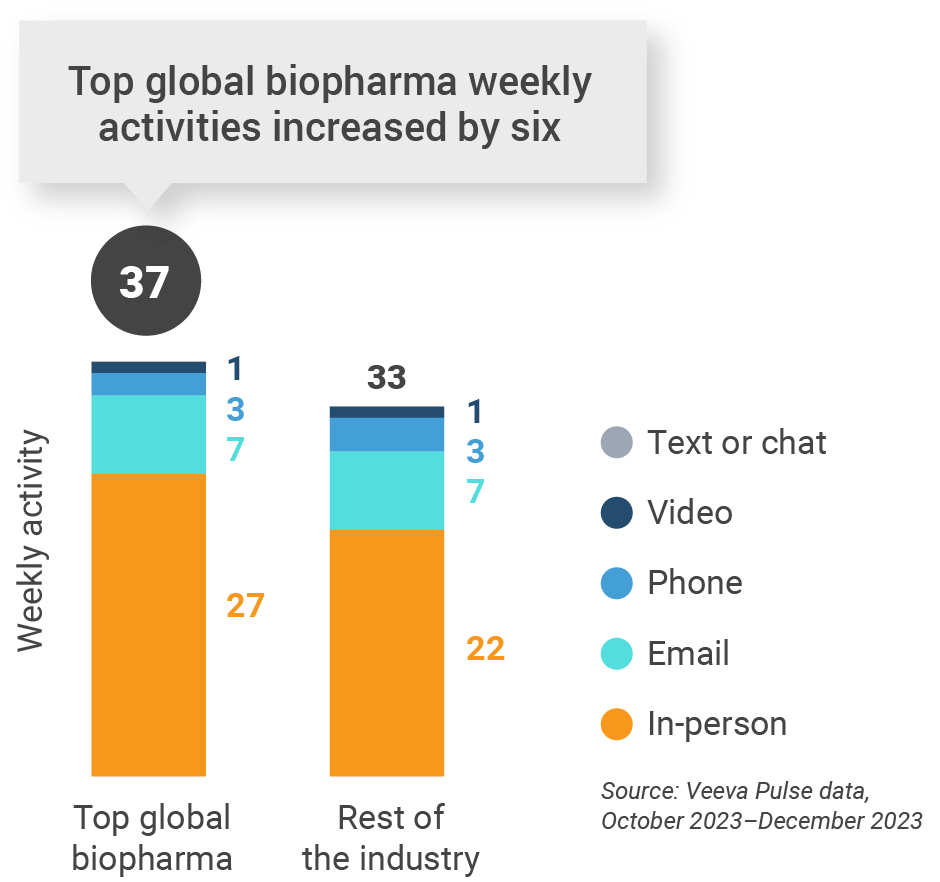
Figure 13: Activity by company size, U.S.
U.S. engagement quality
Consolidation of key quality metrics
Figure 14: Approved email volume, U.S.
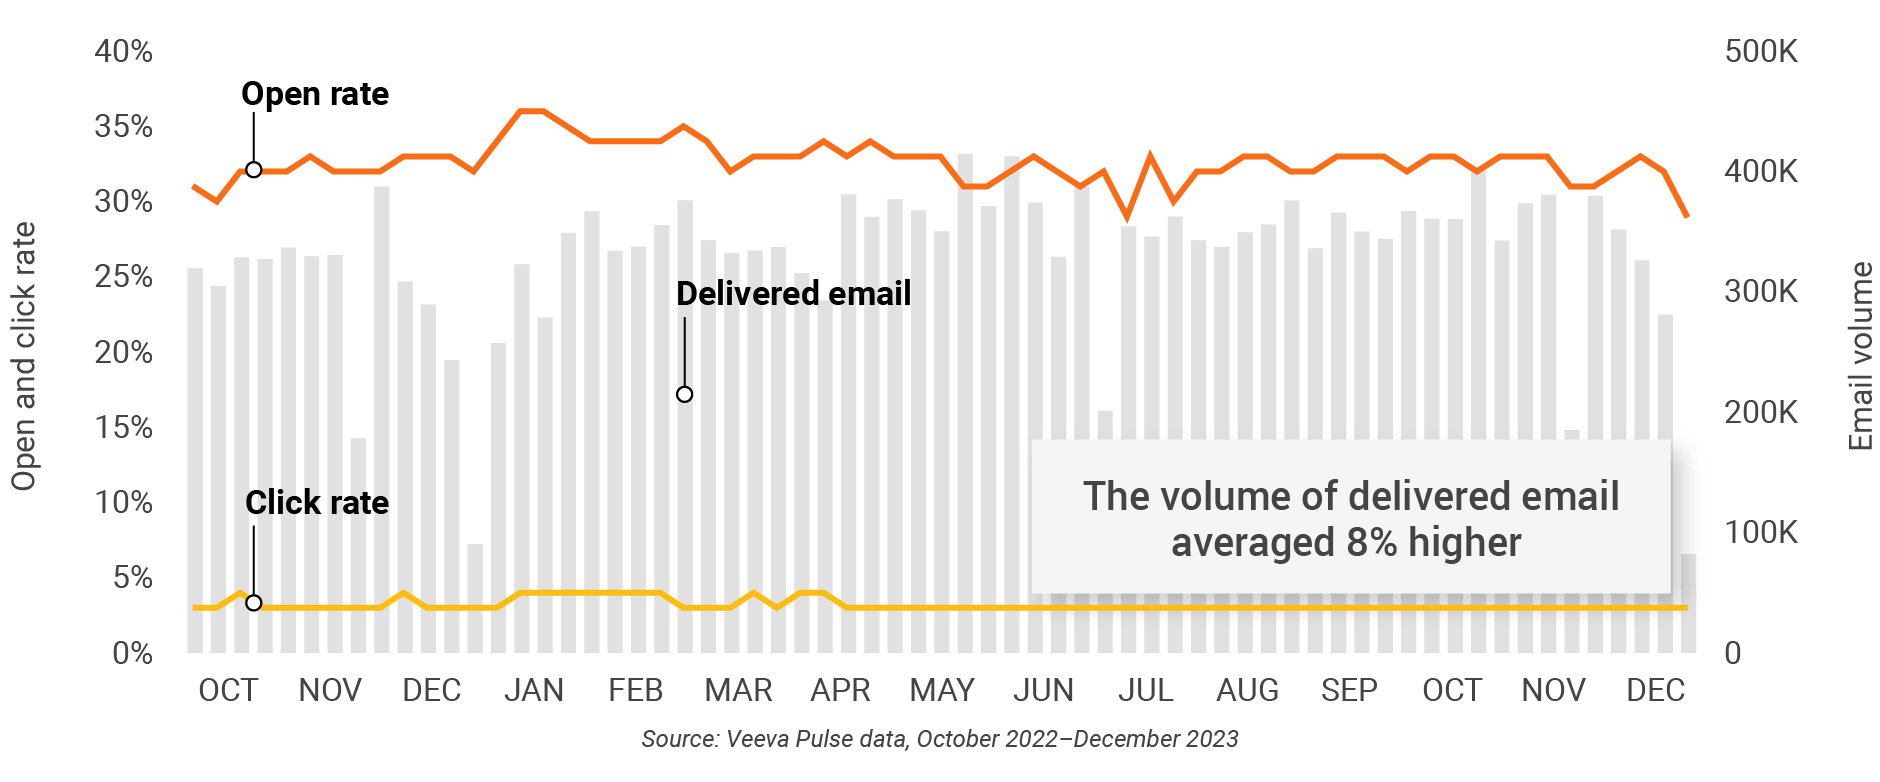
Figure 15: Content usage by channel, U.S.
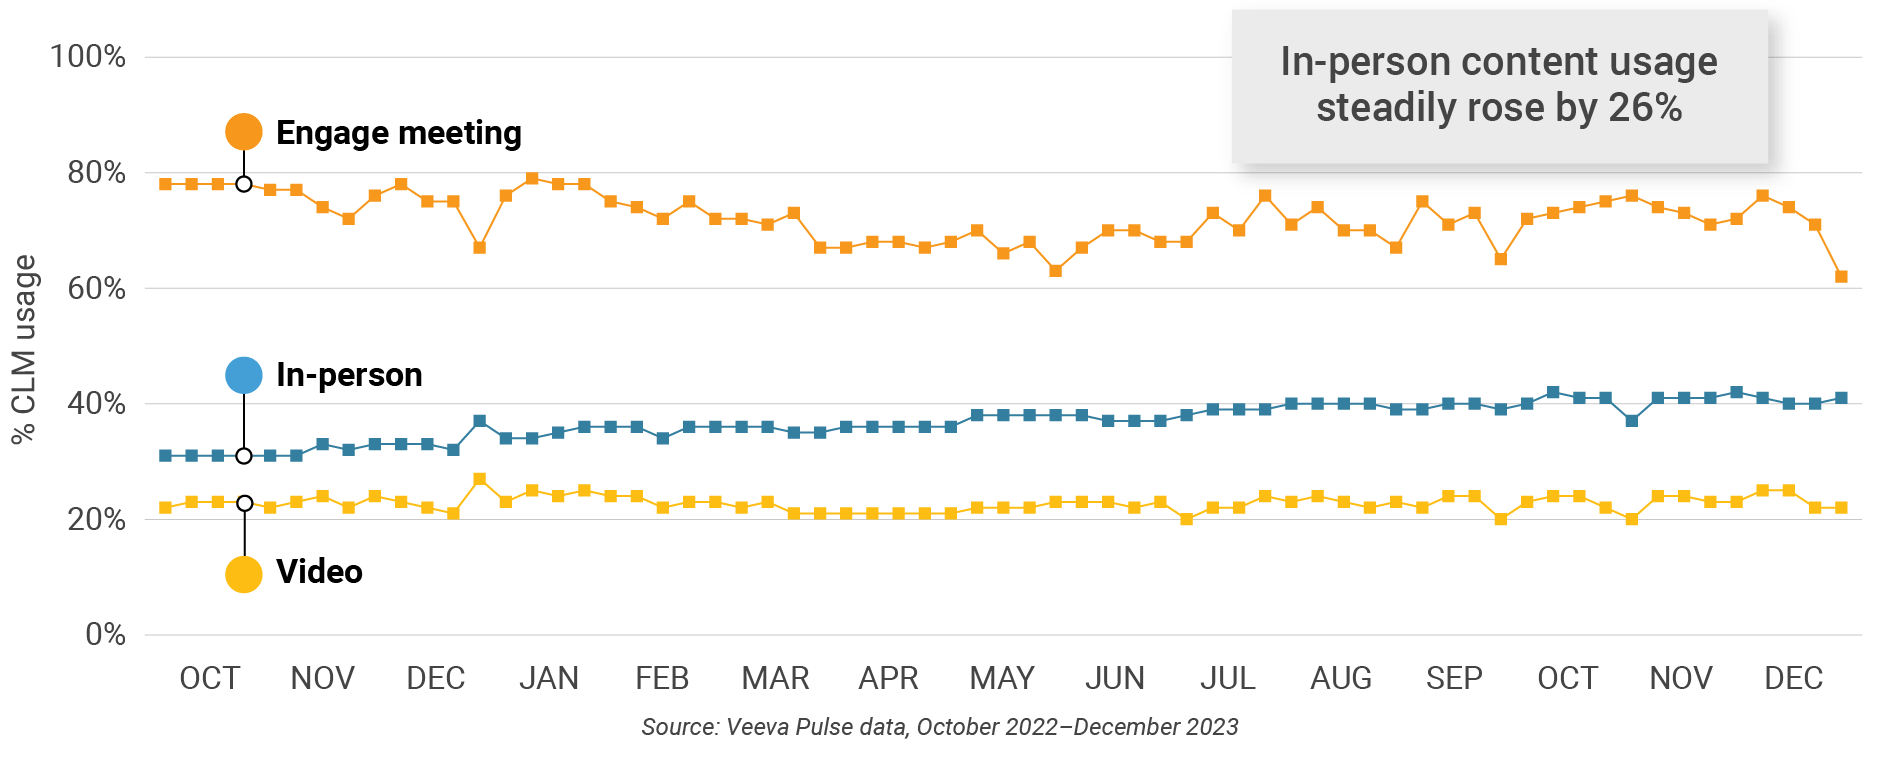
Figure 16: Veeva CRM Engage meeting duration, U.S.

Europe market trends
Figure 17: Channel mix evolution, Europe
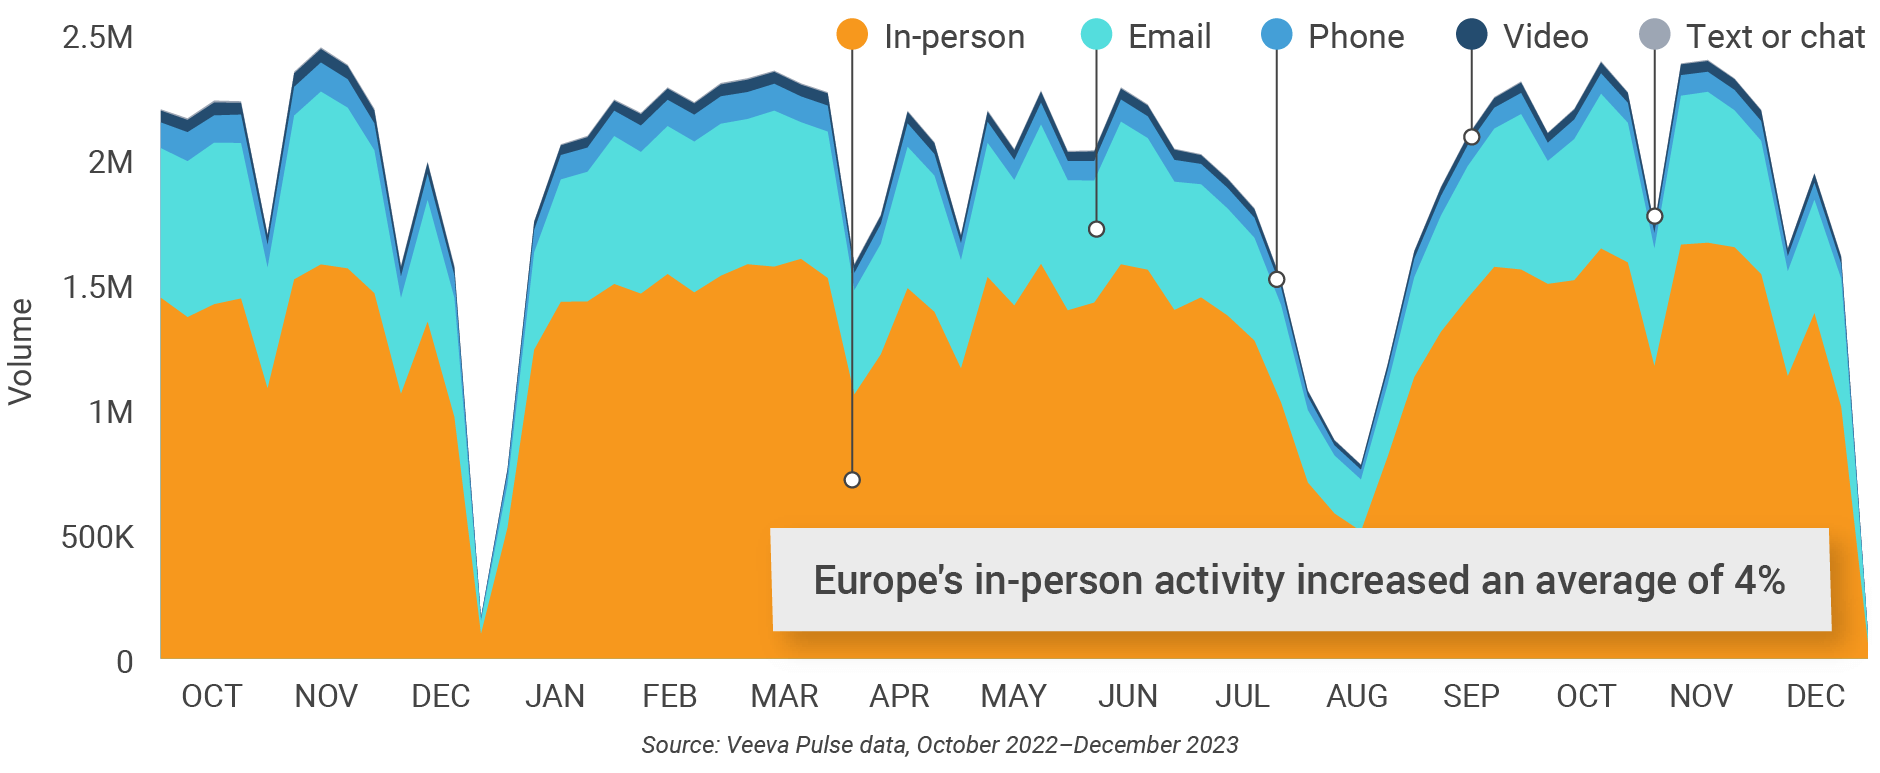
Figure 18: Channel mix, Europe

Europe field team activity
Weekly activity per user by engagement channel
Figure 19: Activity by country, EU5
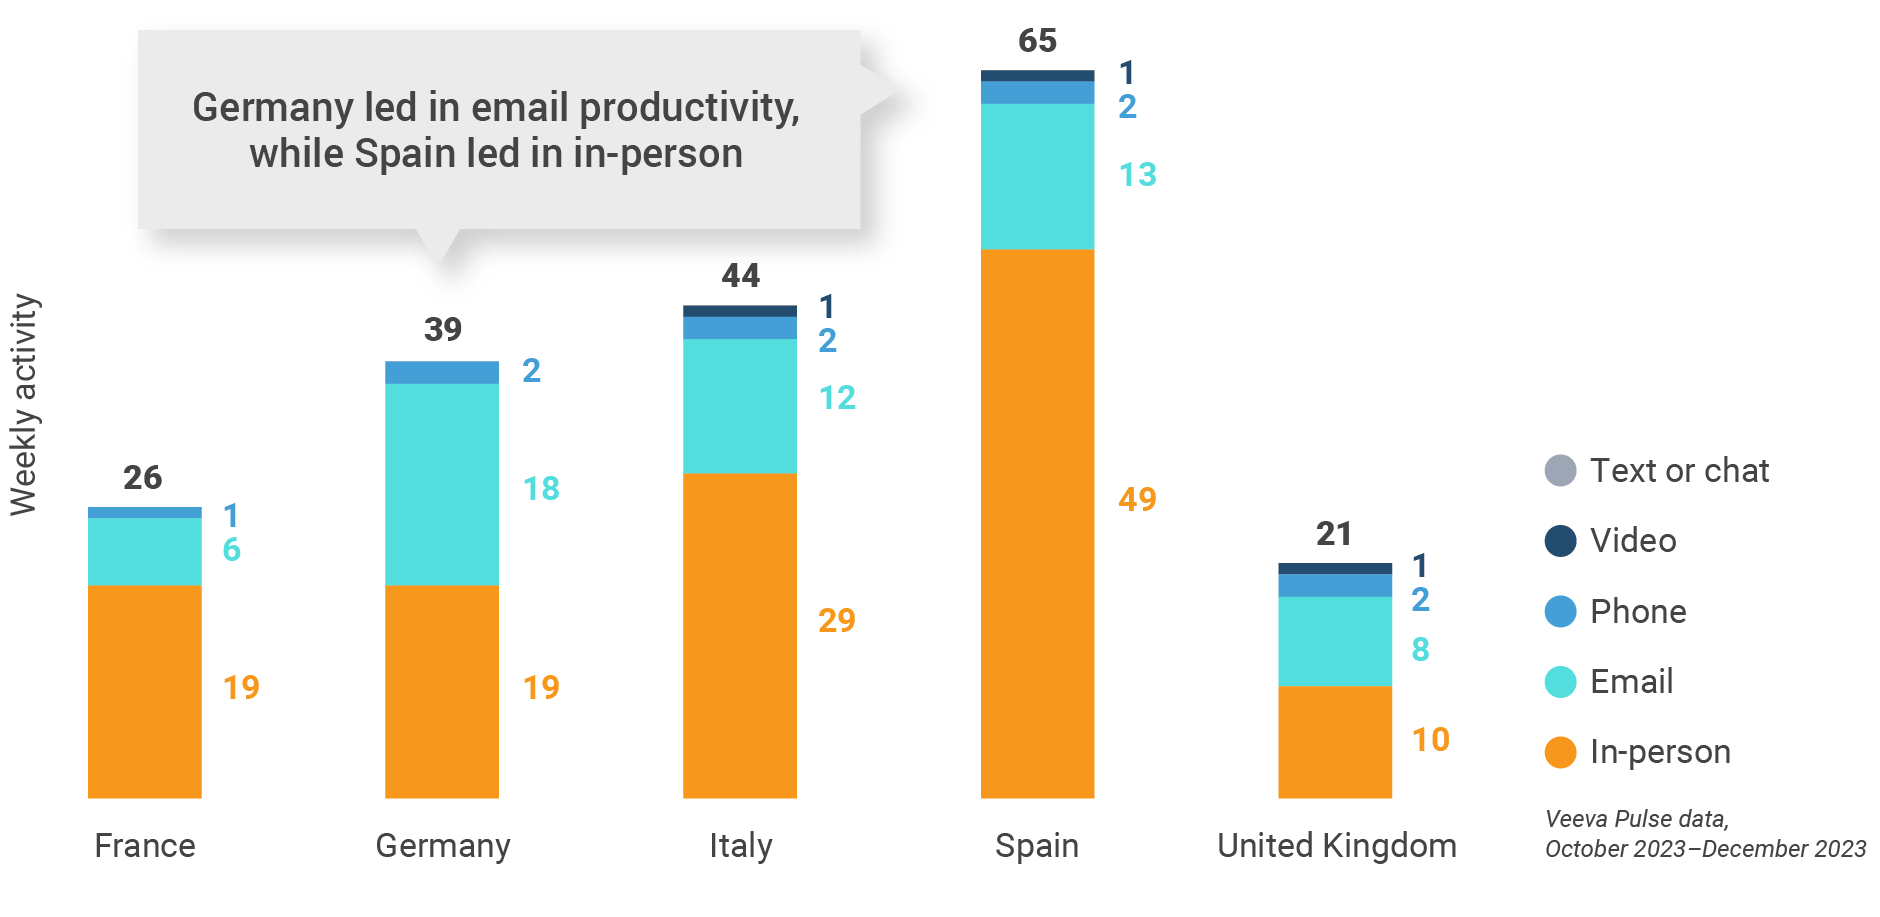
Figure 20: Activity by user type, Europe
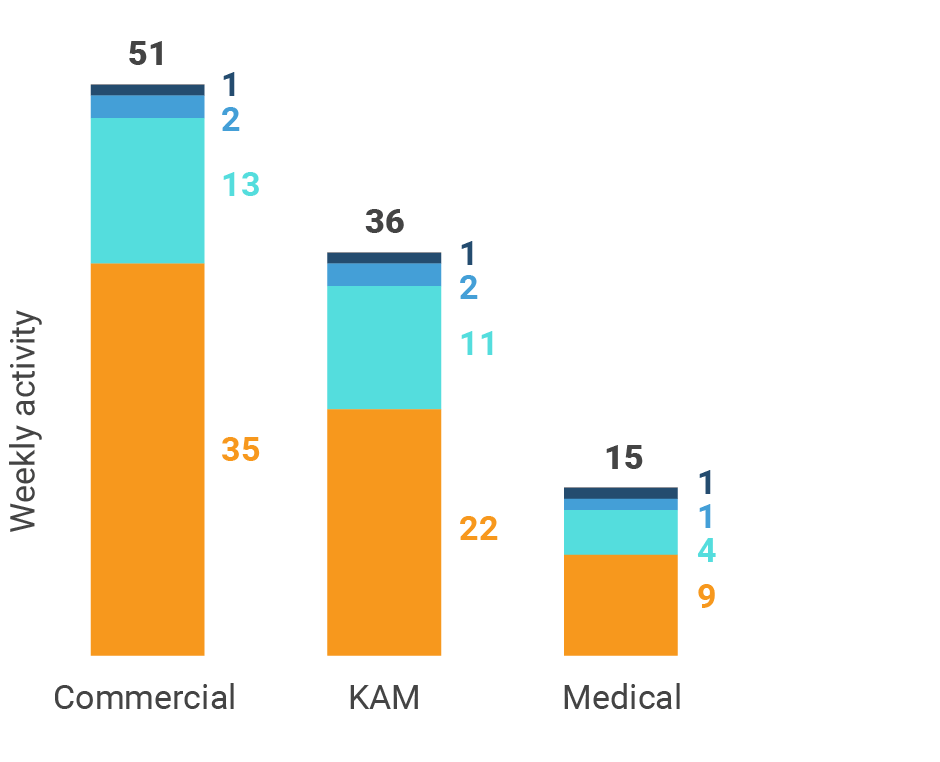
Figure 21: Activity by company size, Europe
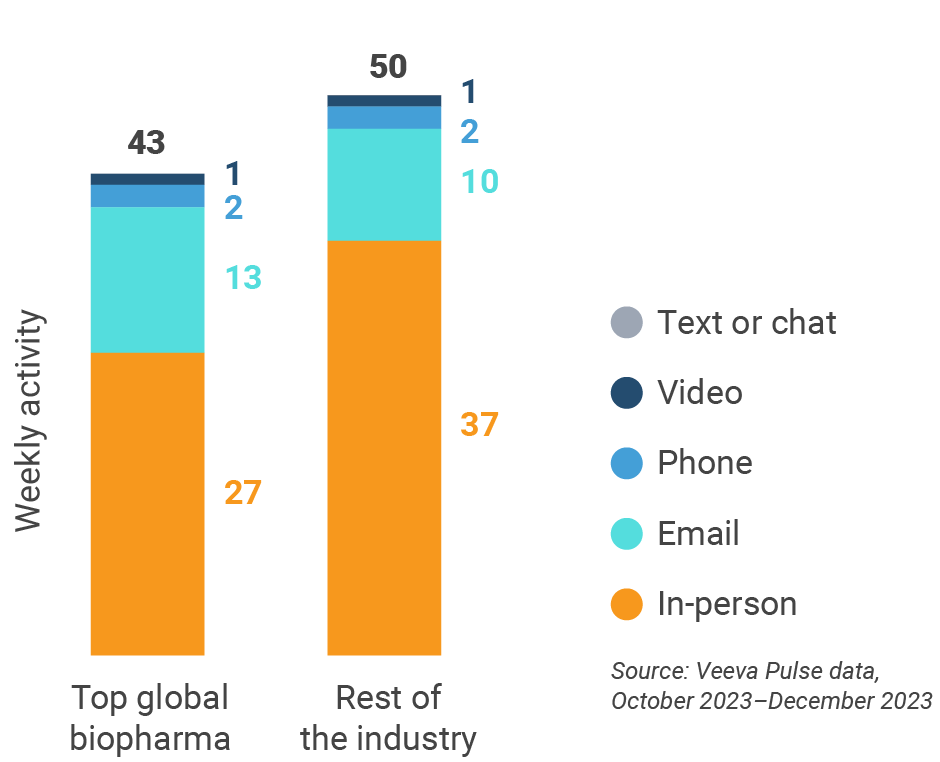
Europe engagement quality
Consolidation of key quality metrics
Figure 22: Approved email volume, Europe
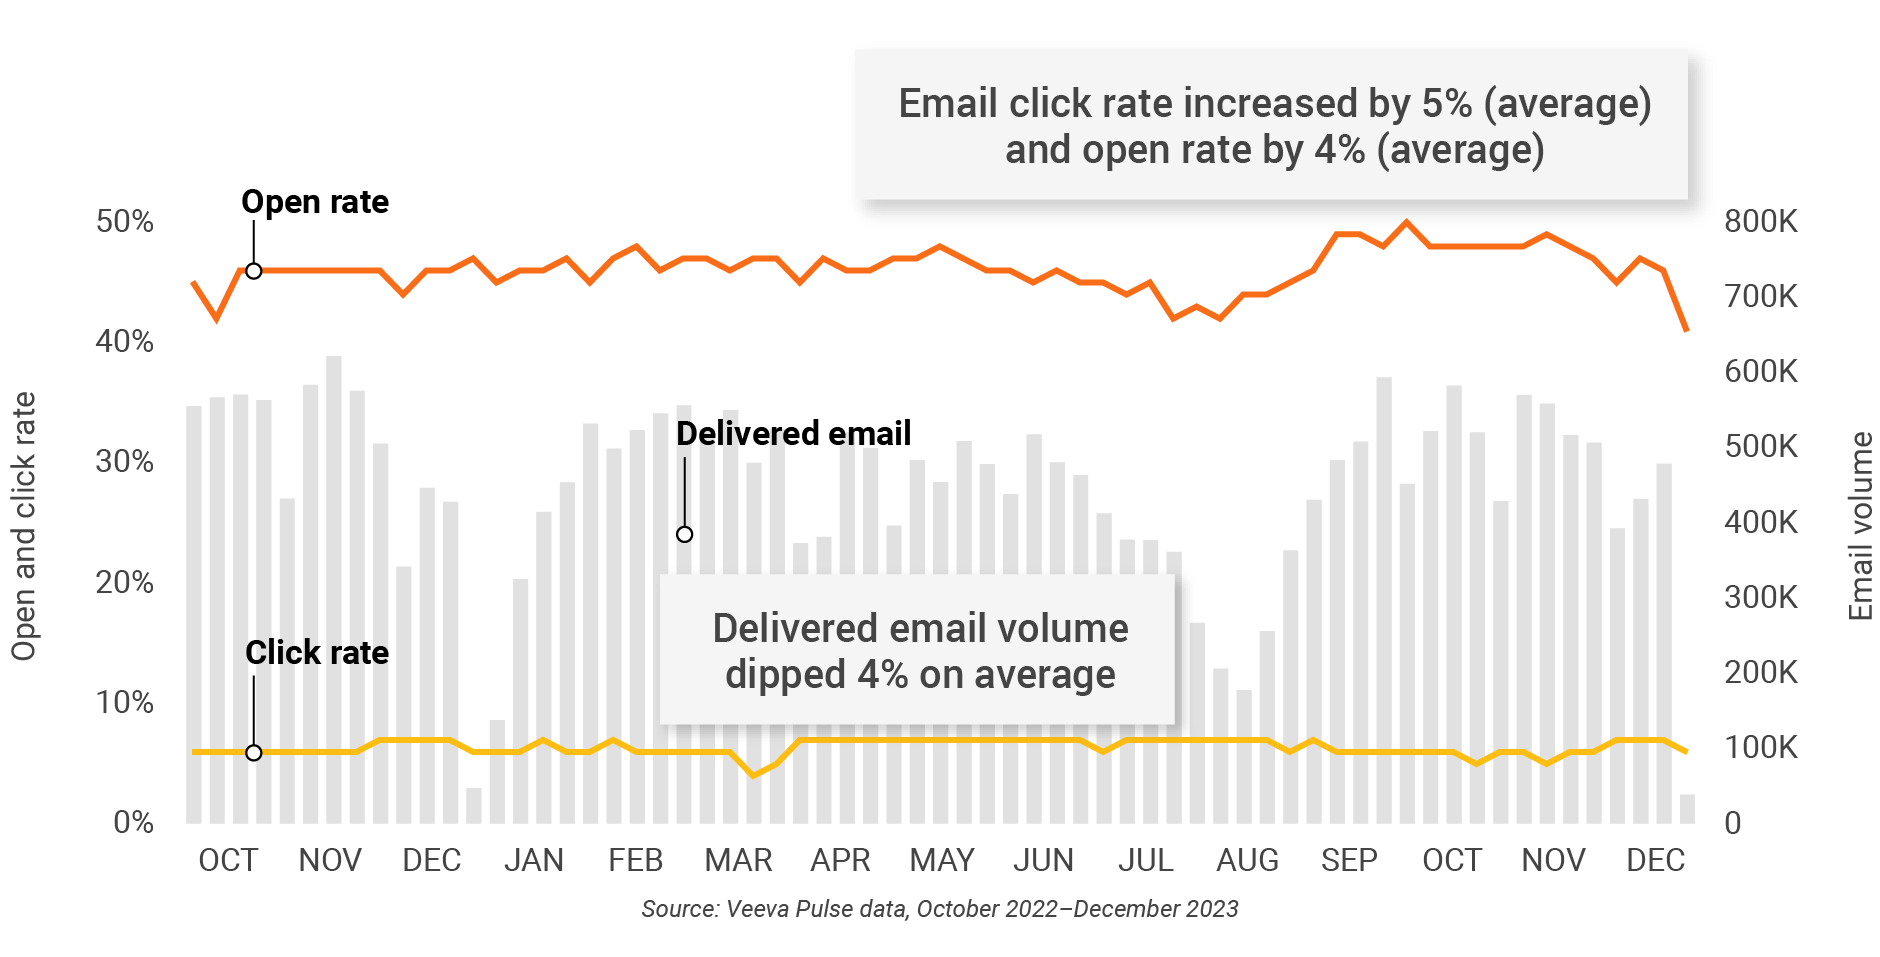
Figure 23: Content usage by channel, Europe
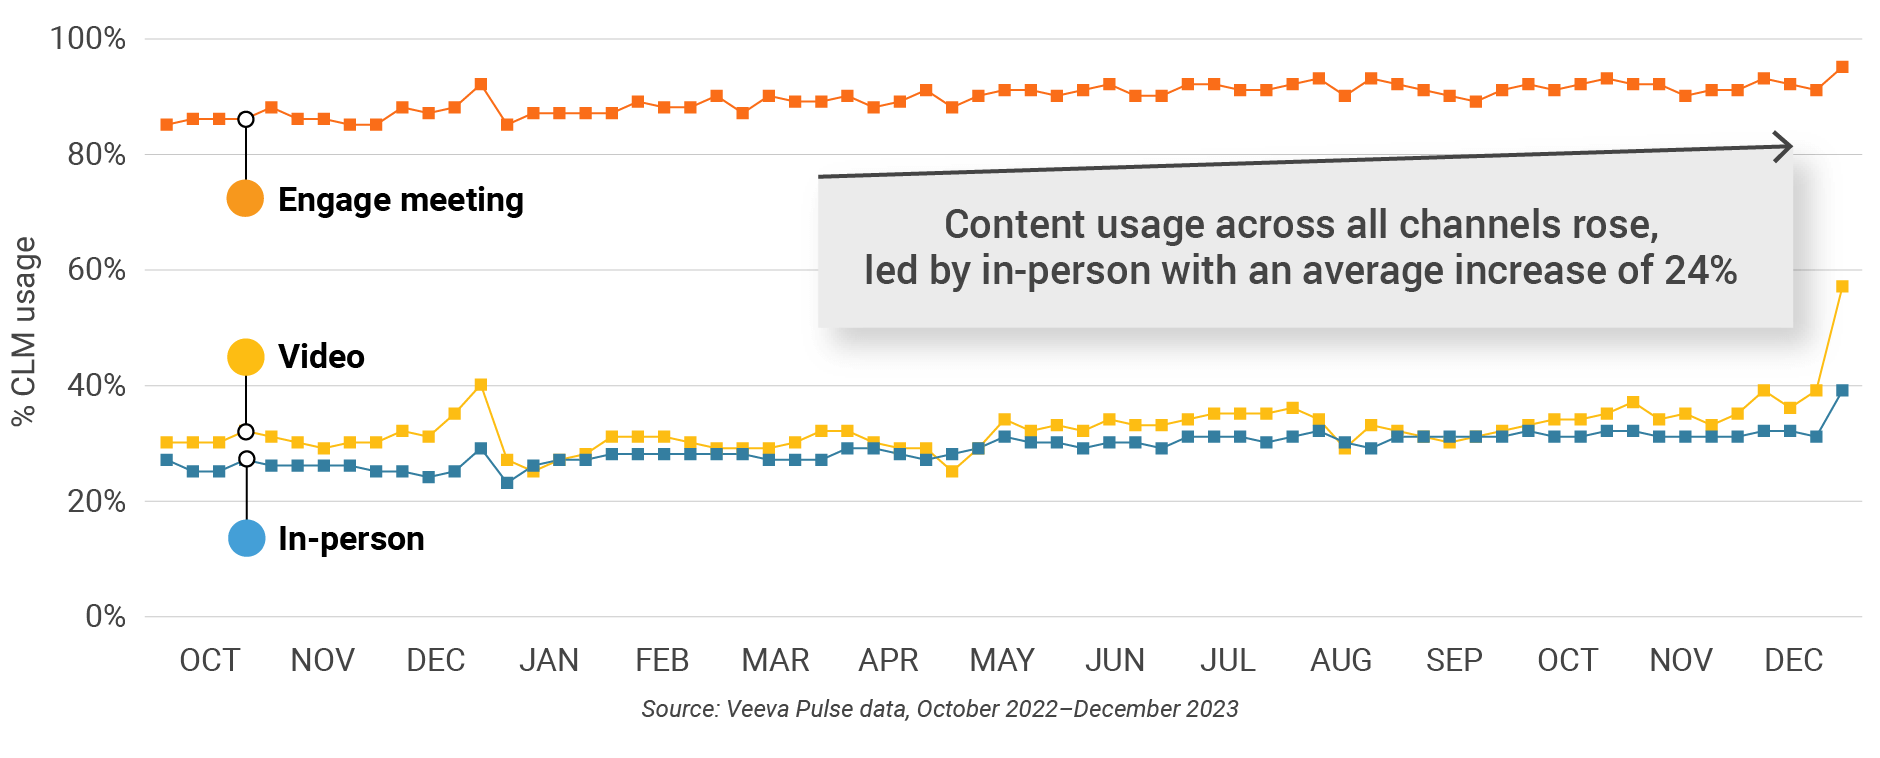
Figure 24: Veeva CRM Engage meeting duration, Europe

Asia market trends
Figure 25: Channel mix evolution, Asia
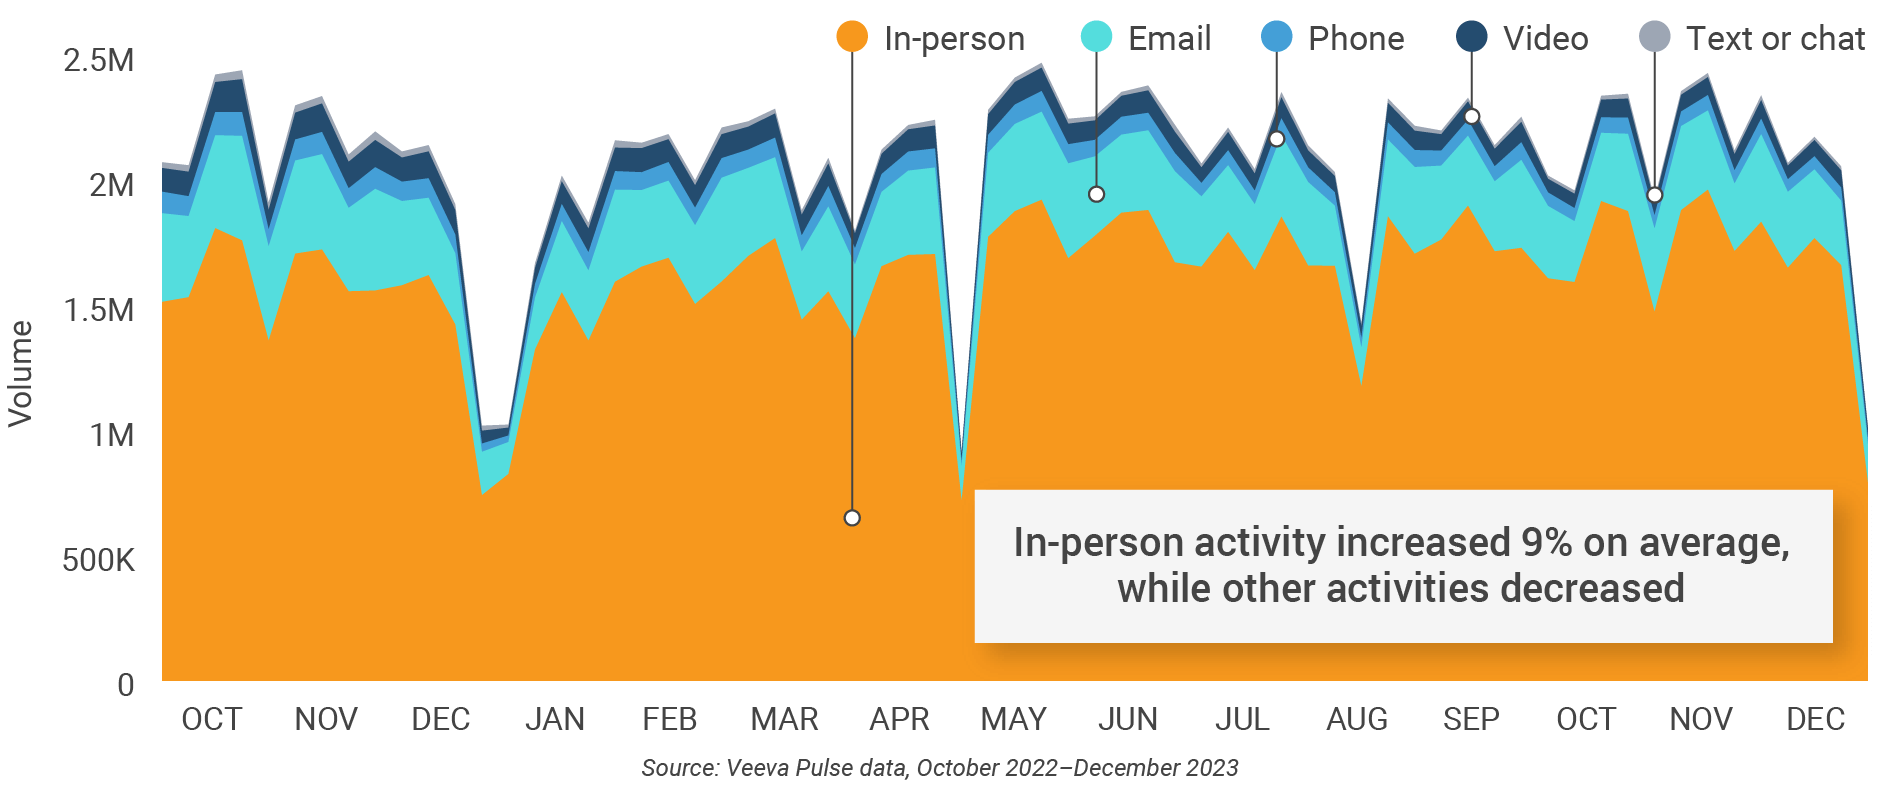
Figure 26: Channel mix, Asia

Asia field team activity
Weekly activity per user by engagement channel
Figure 27: Activity by country, Asia
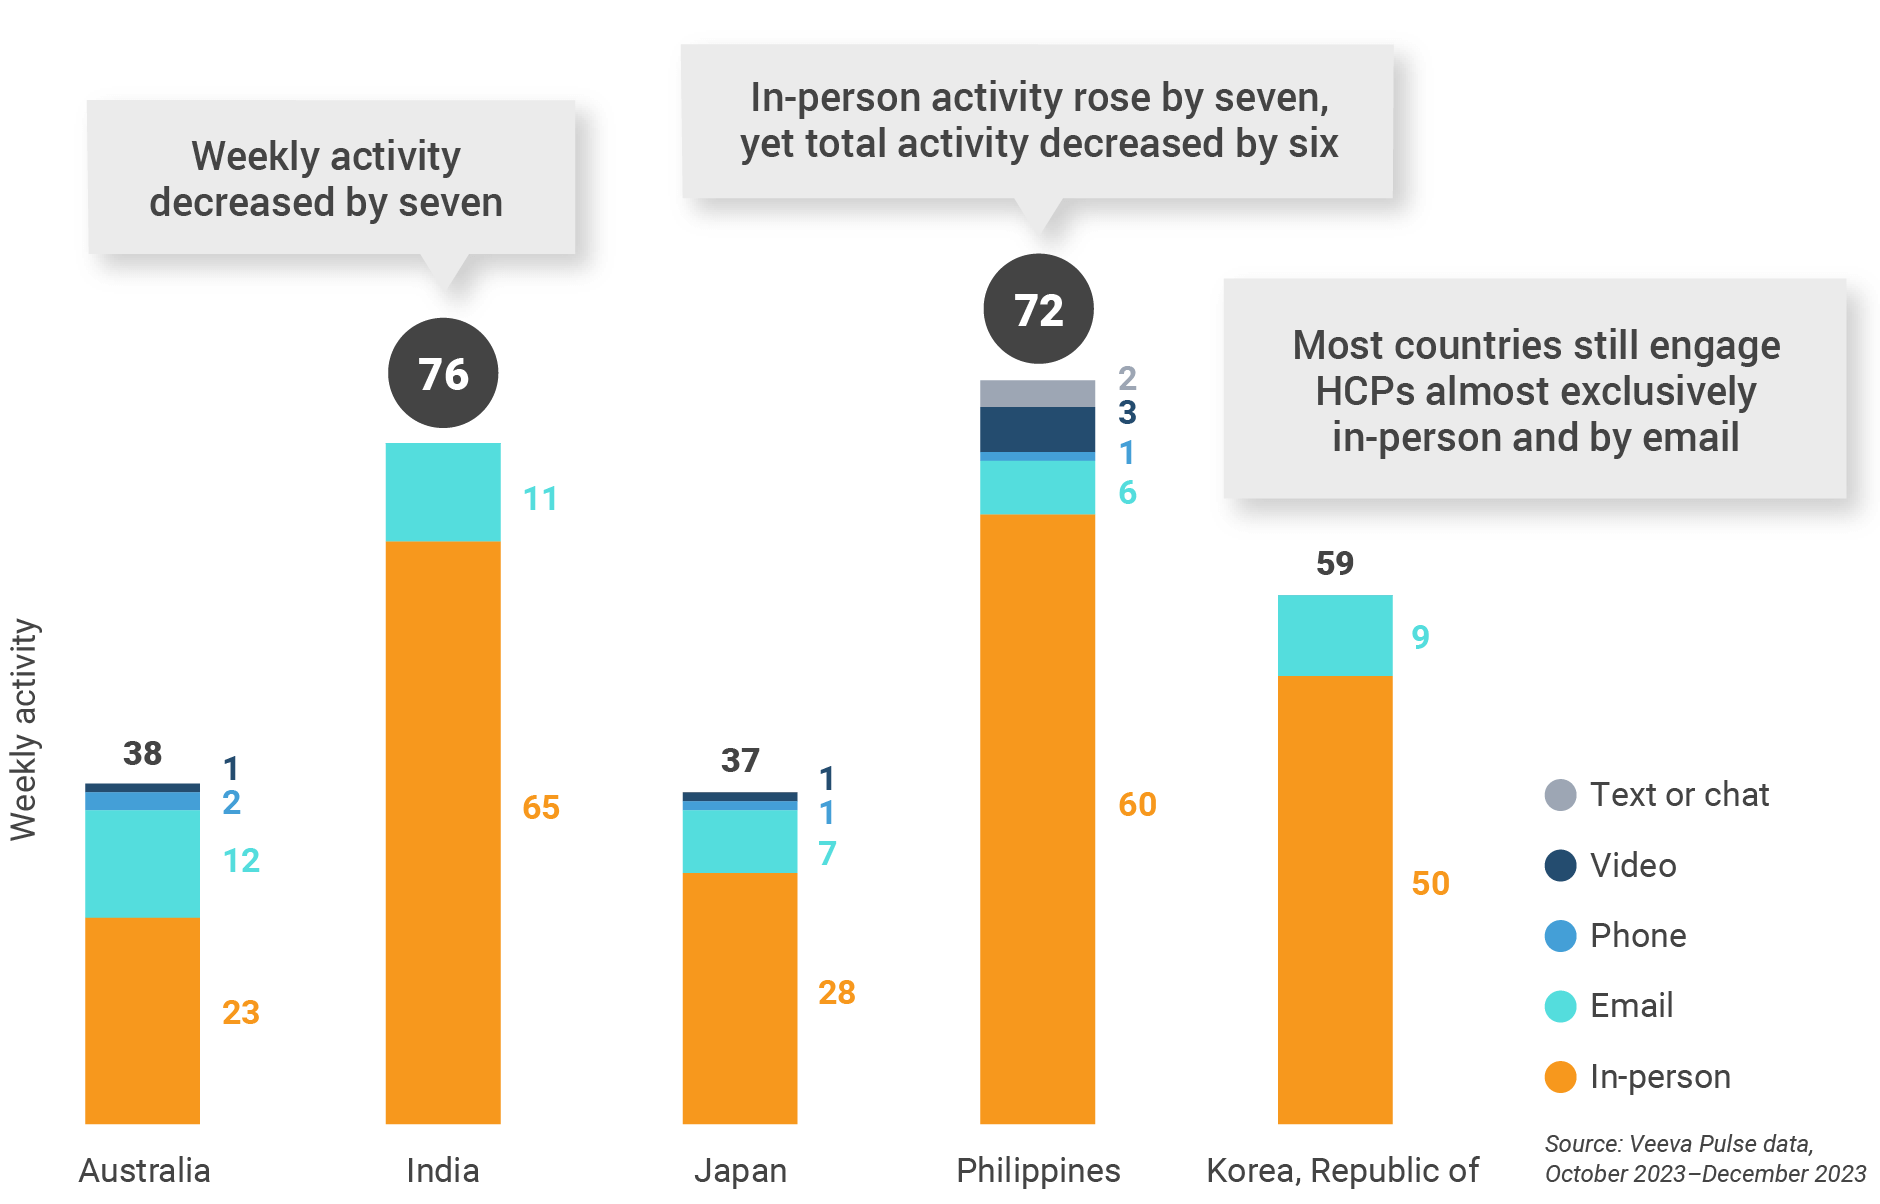
Figure 28: Activity by user type, Asia
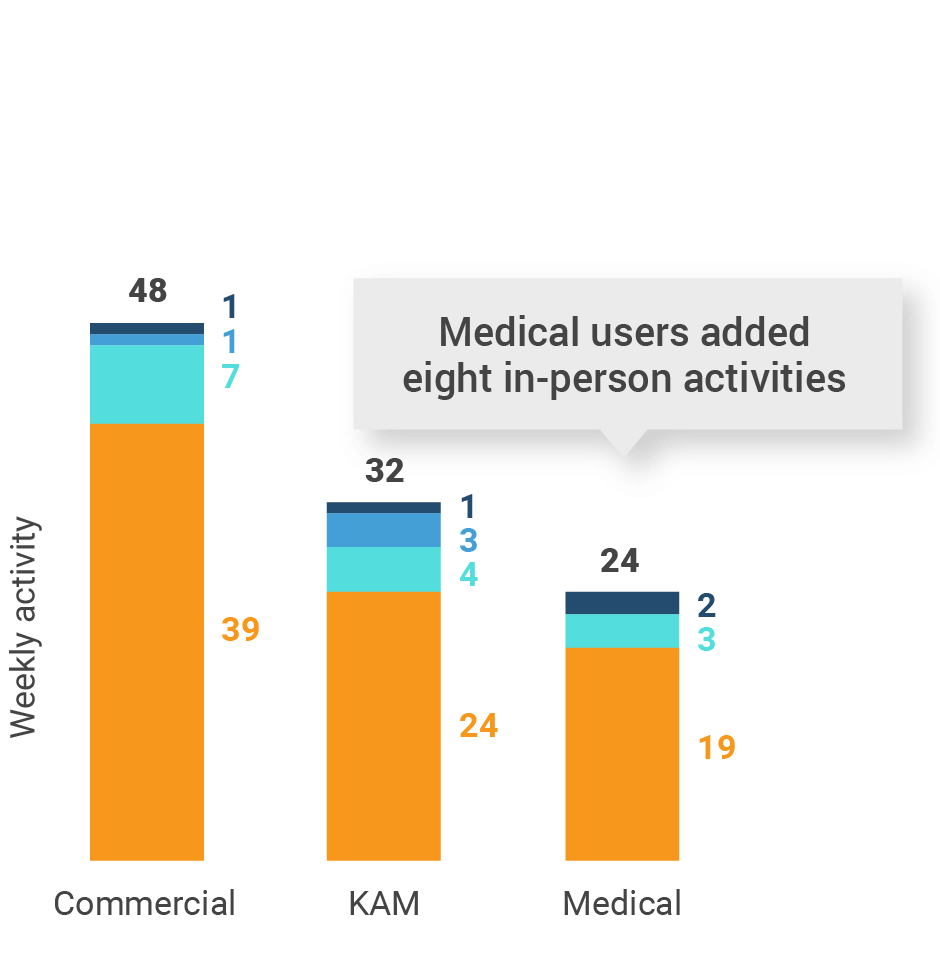
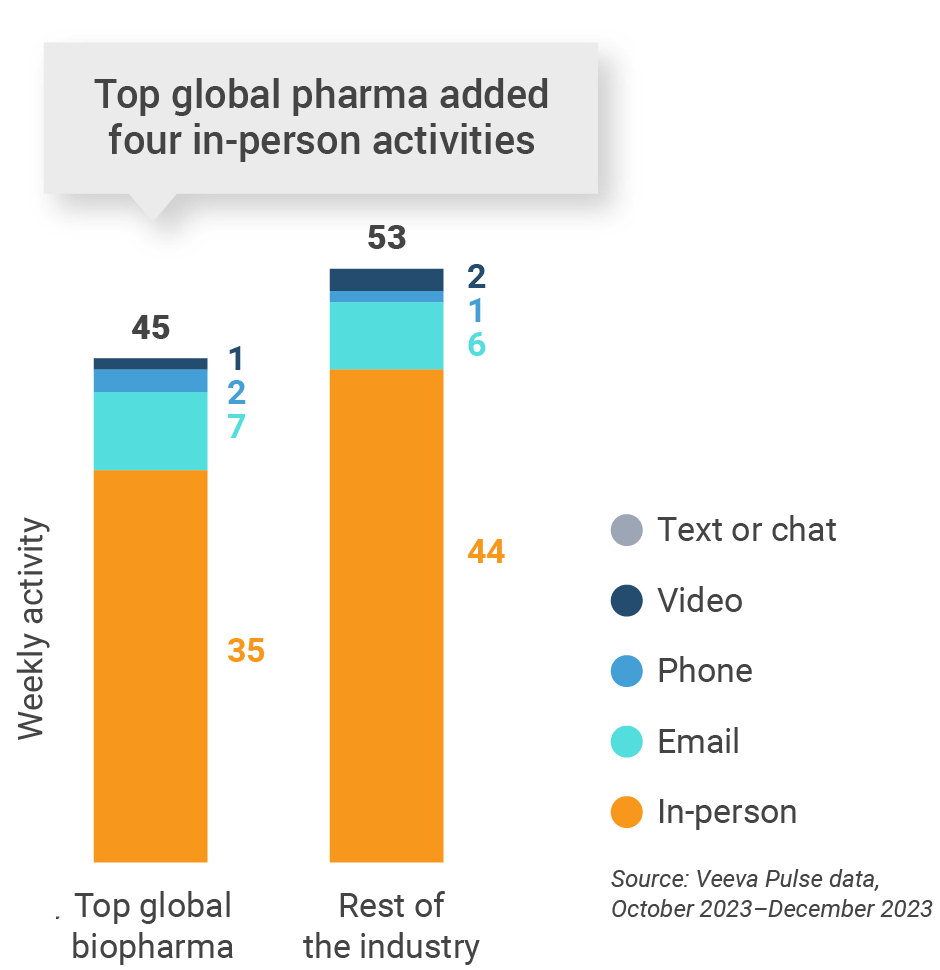
Figure 29: Activity by company size, Asia
Asia engagement quality
Consolidation of key quality metrics
Figure 30: Approved email volume, Asia
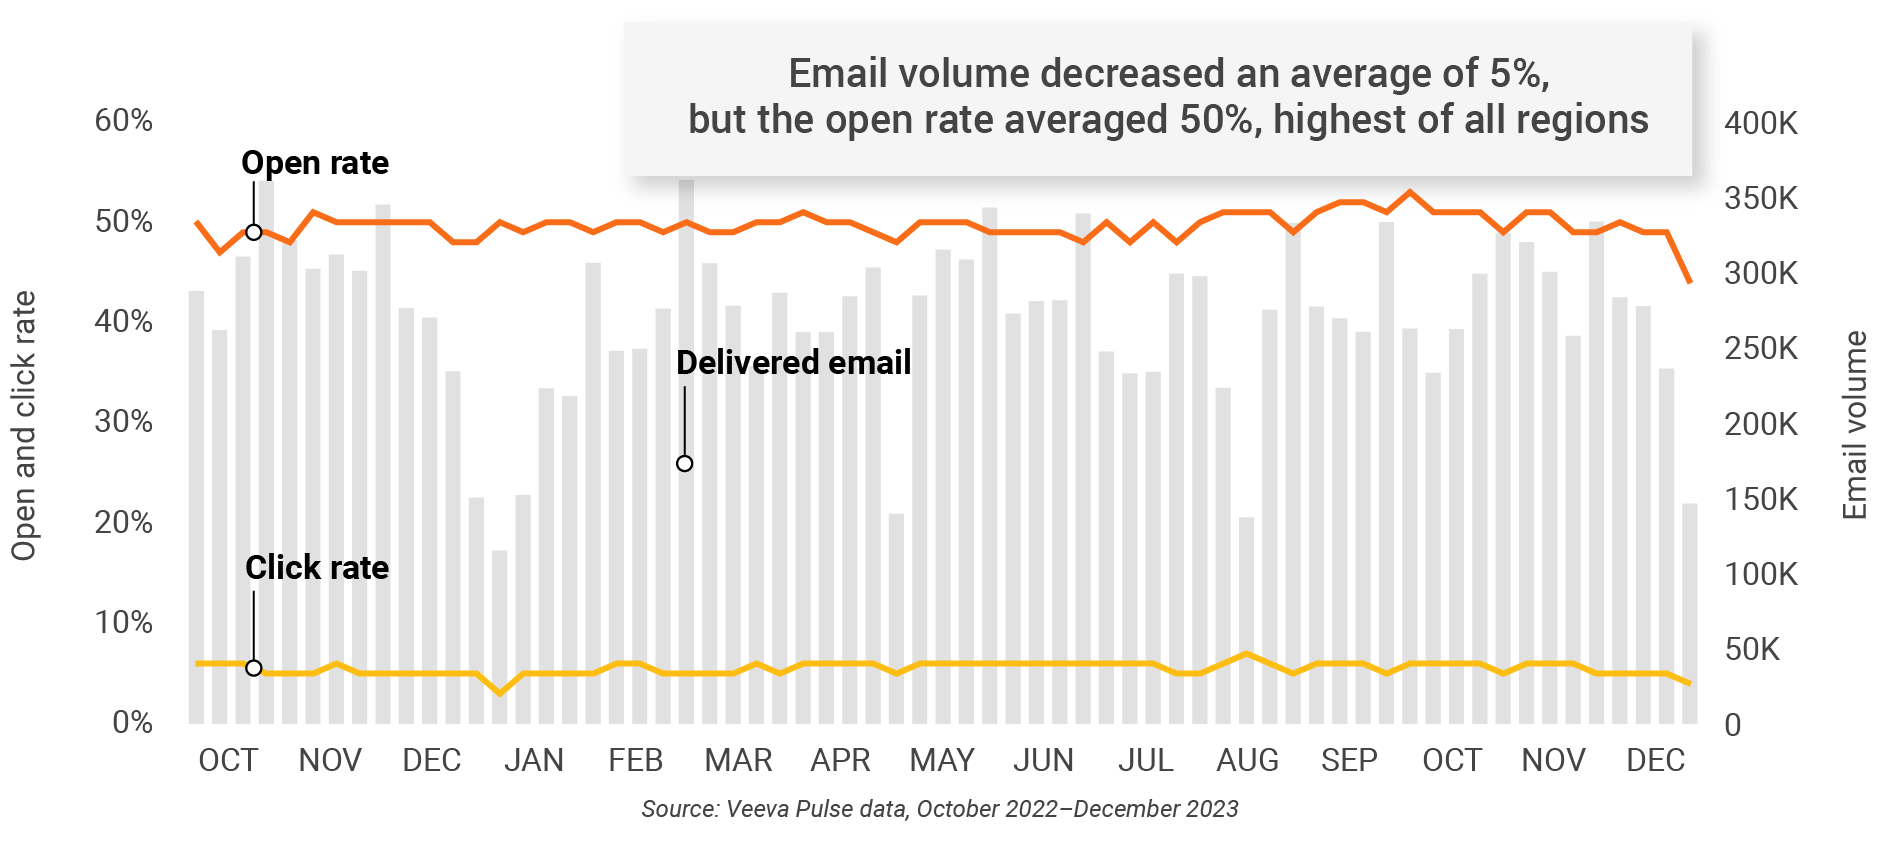
Figure 31: Content usage by channel, Asia
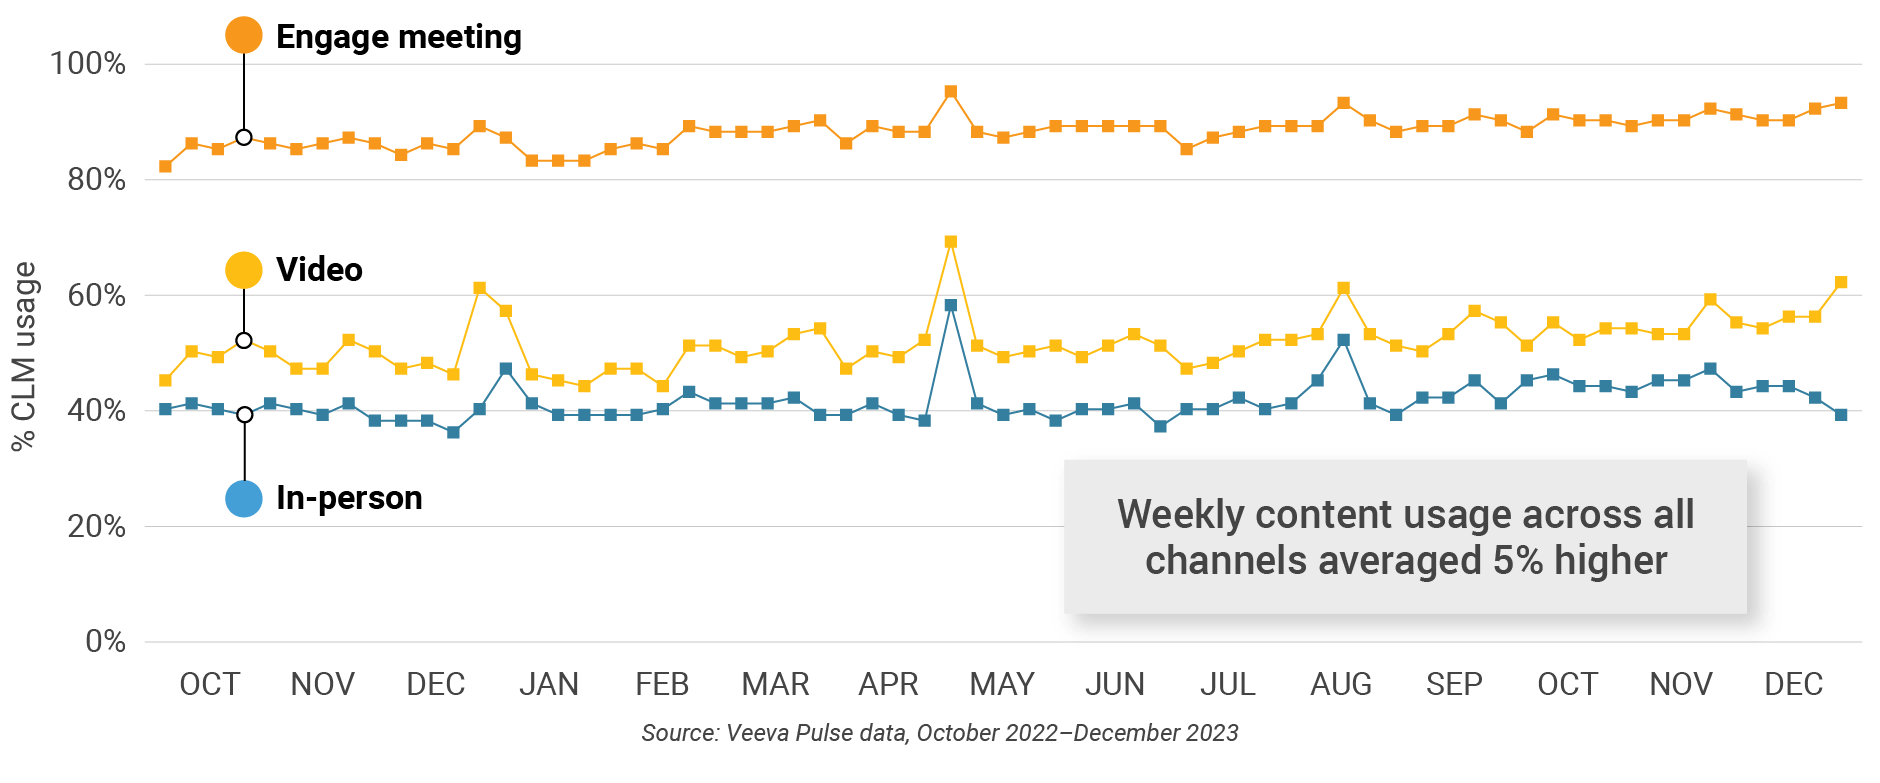
Figure 32: Veeva CRM Engage meeting duration, Asia

Latin America market trends
Figure 33: Channel mix evolution, Latin America
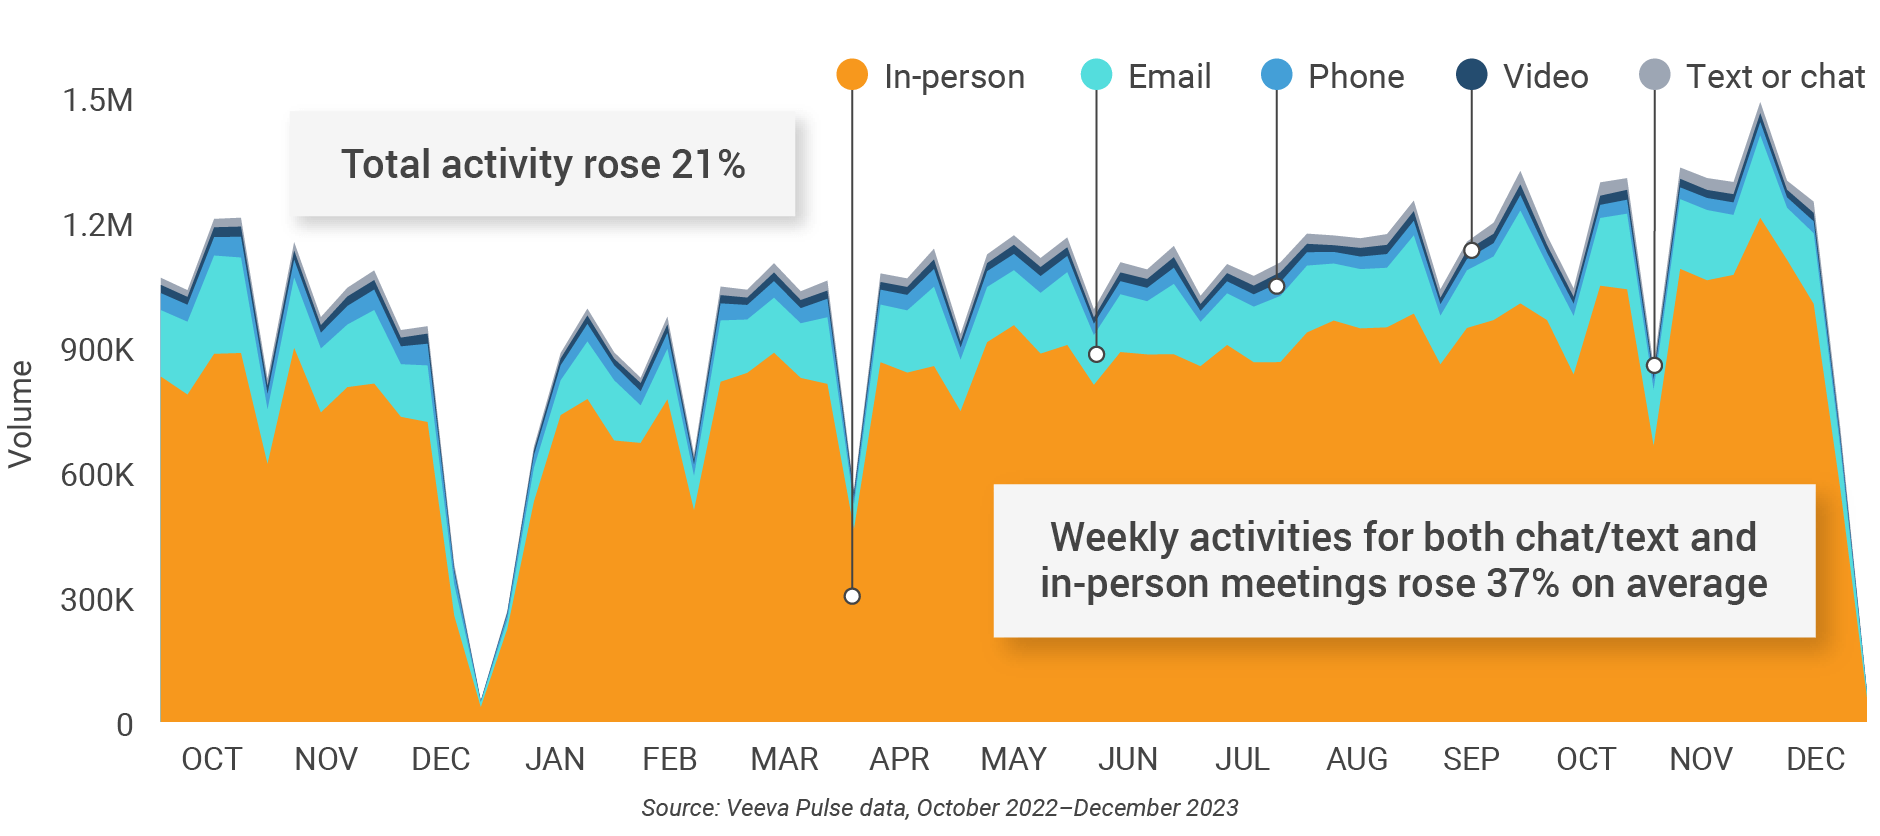
Figure 34: Channel mix, Latin America

Latin America field team activity
Weekly activity per user by engagement channel
Figure 35: Activity by country, Latin America
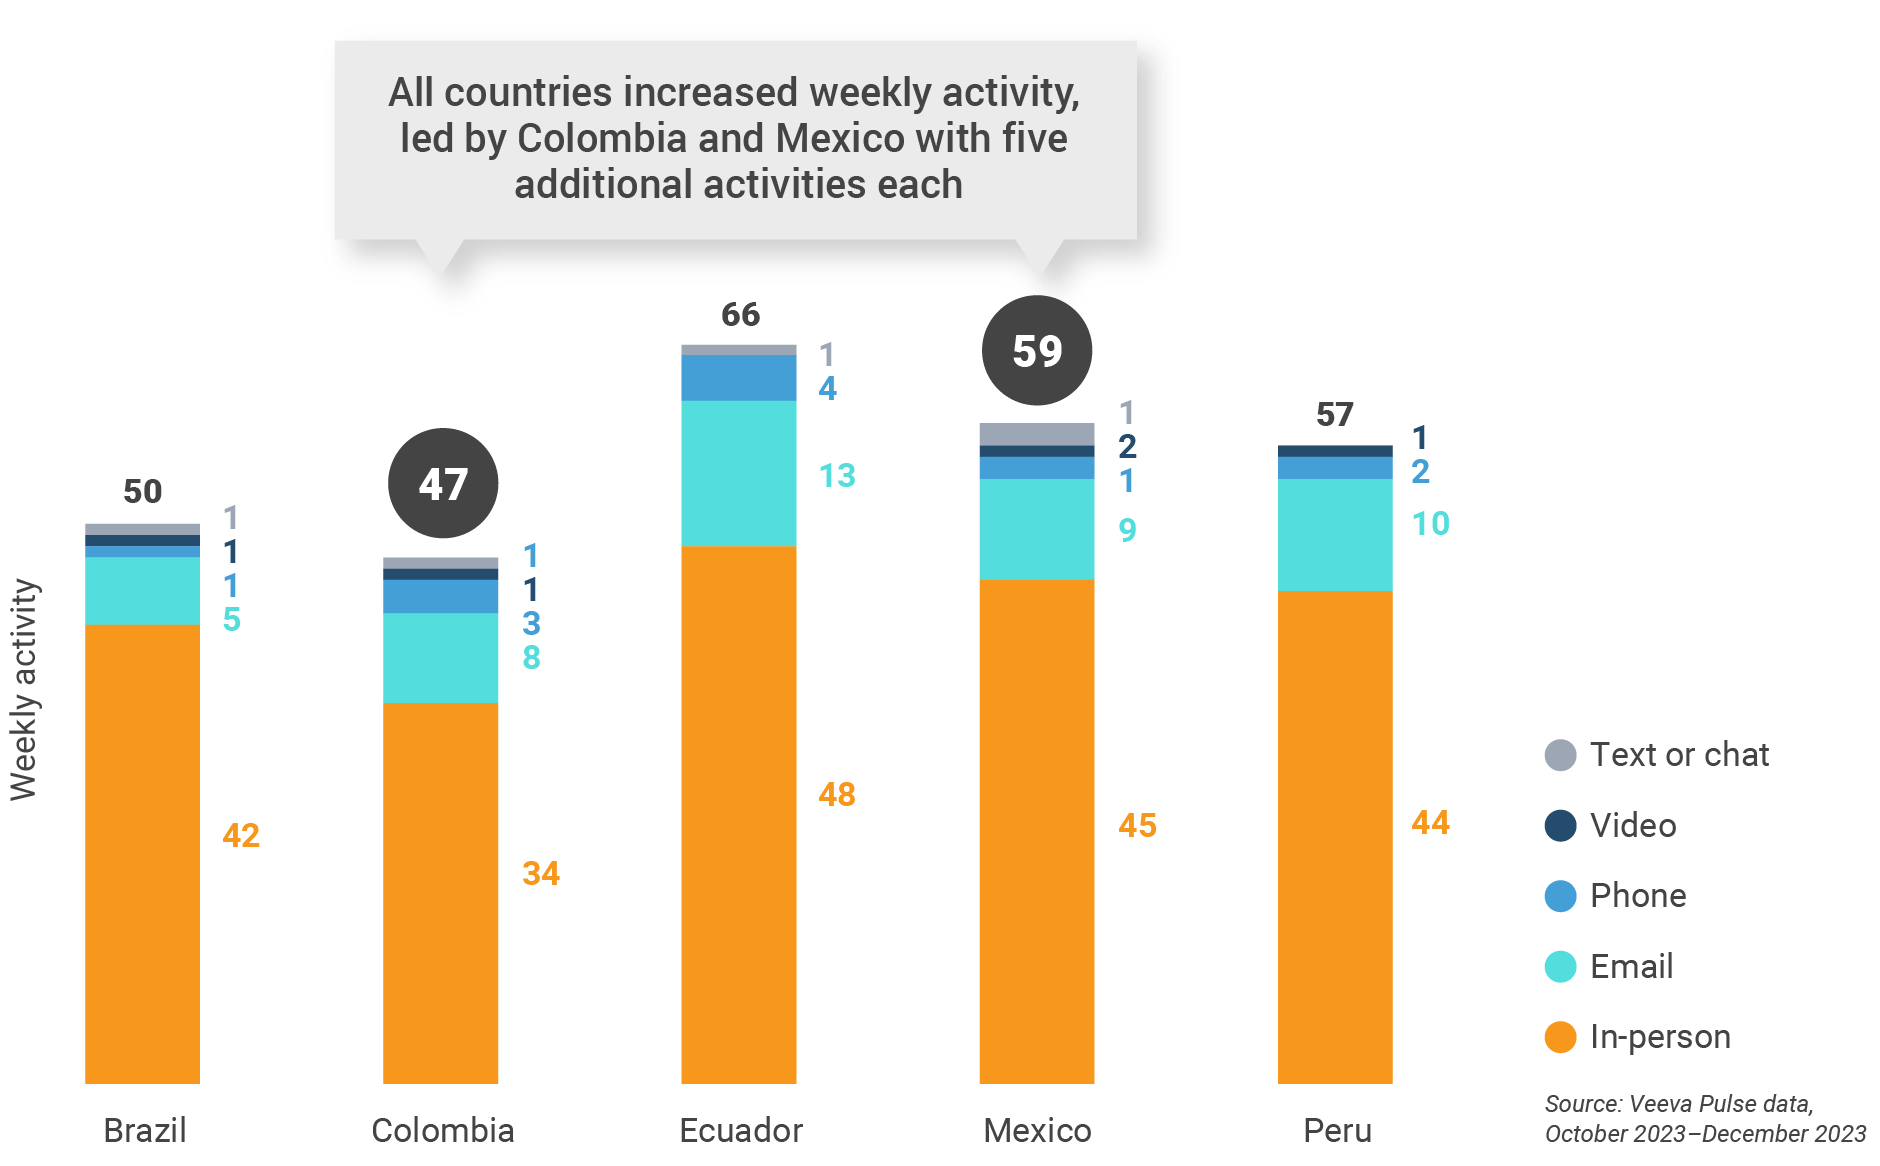
Figure 36: Activity by user type, Latin America
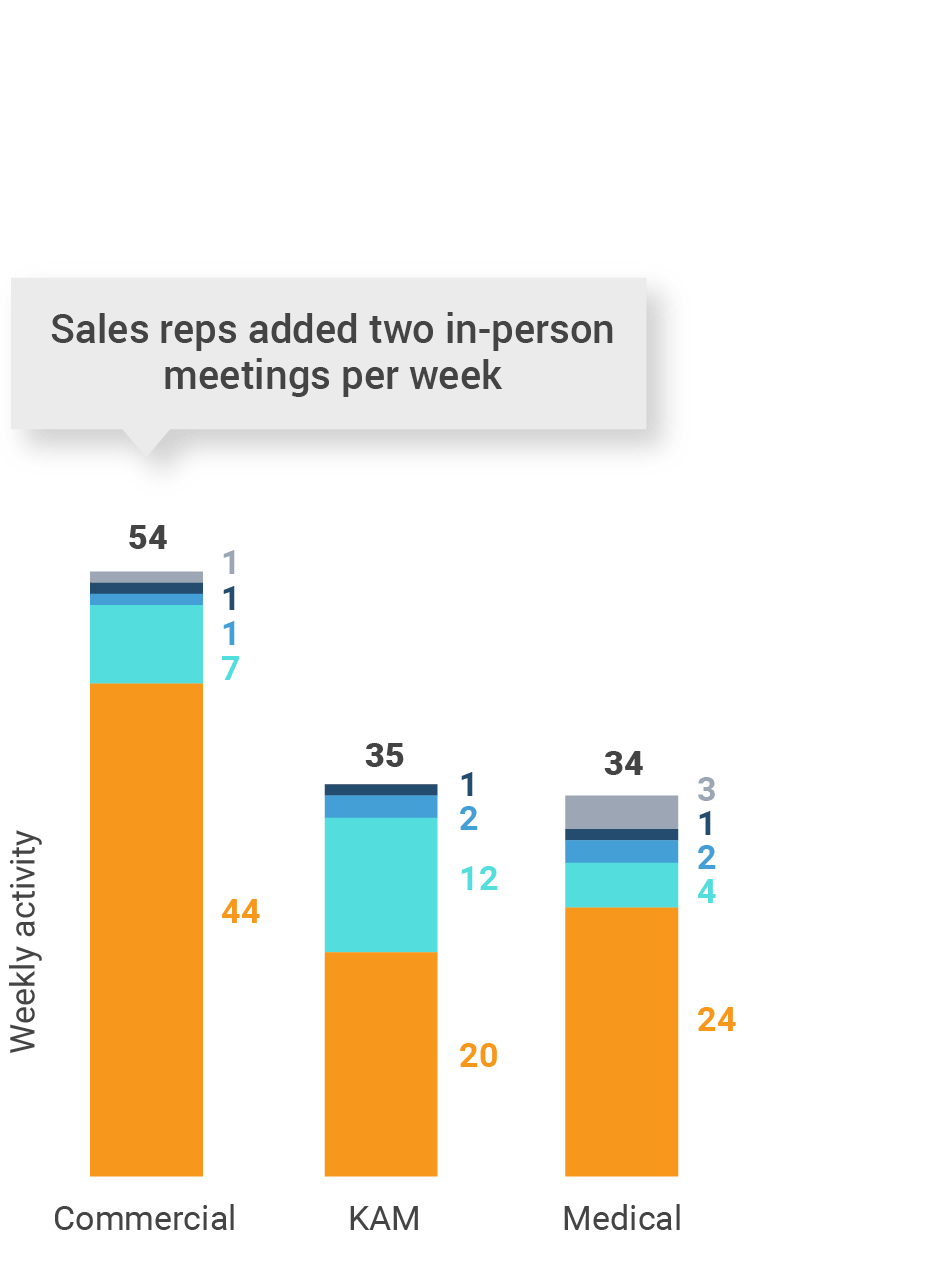
Figure 37: Activity by company size, Latin America
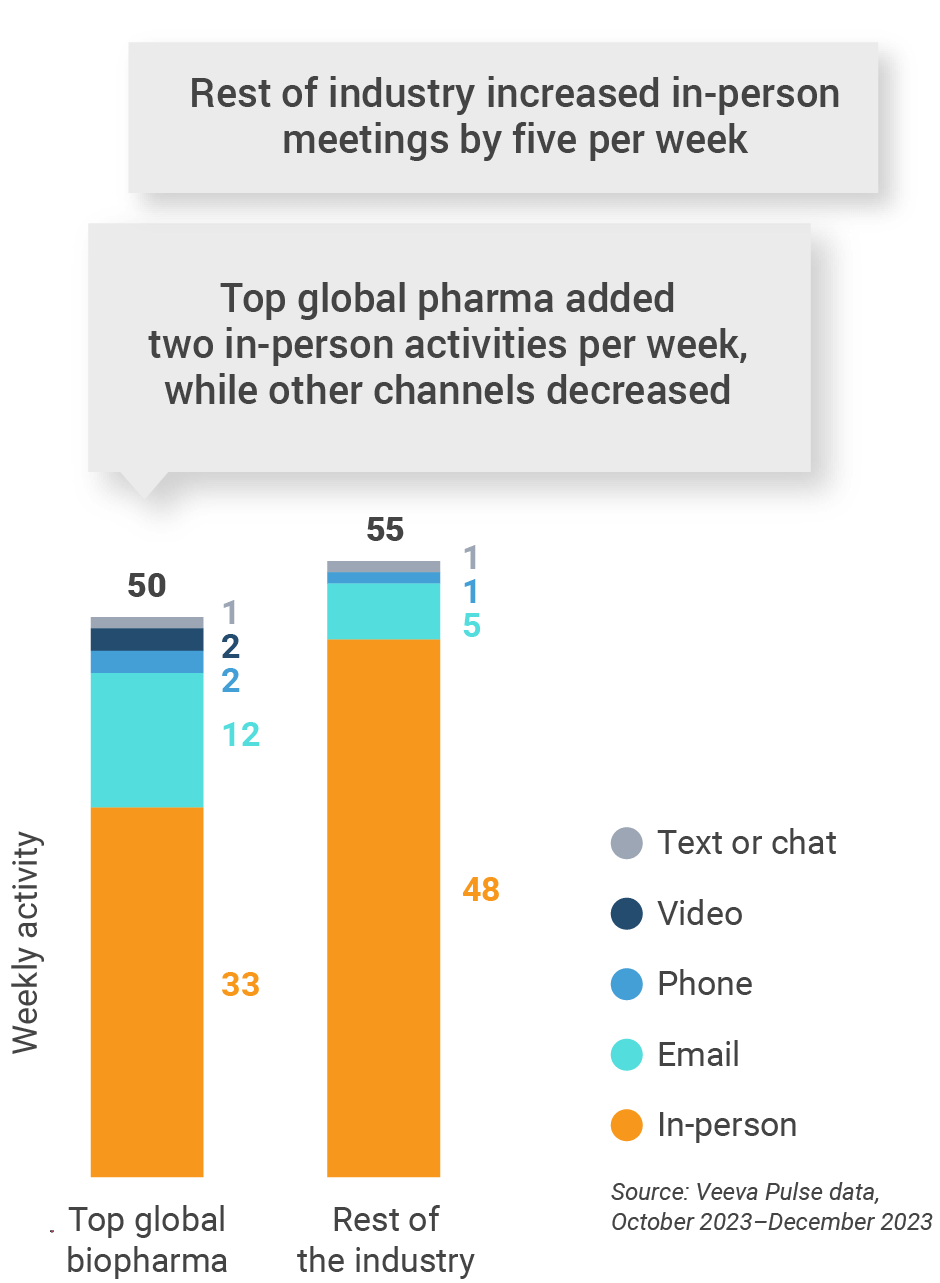
Latin America engagement quality
Consolidation of key quality metrics
Figure 38: Approved email volume, Latin America
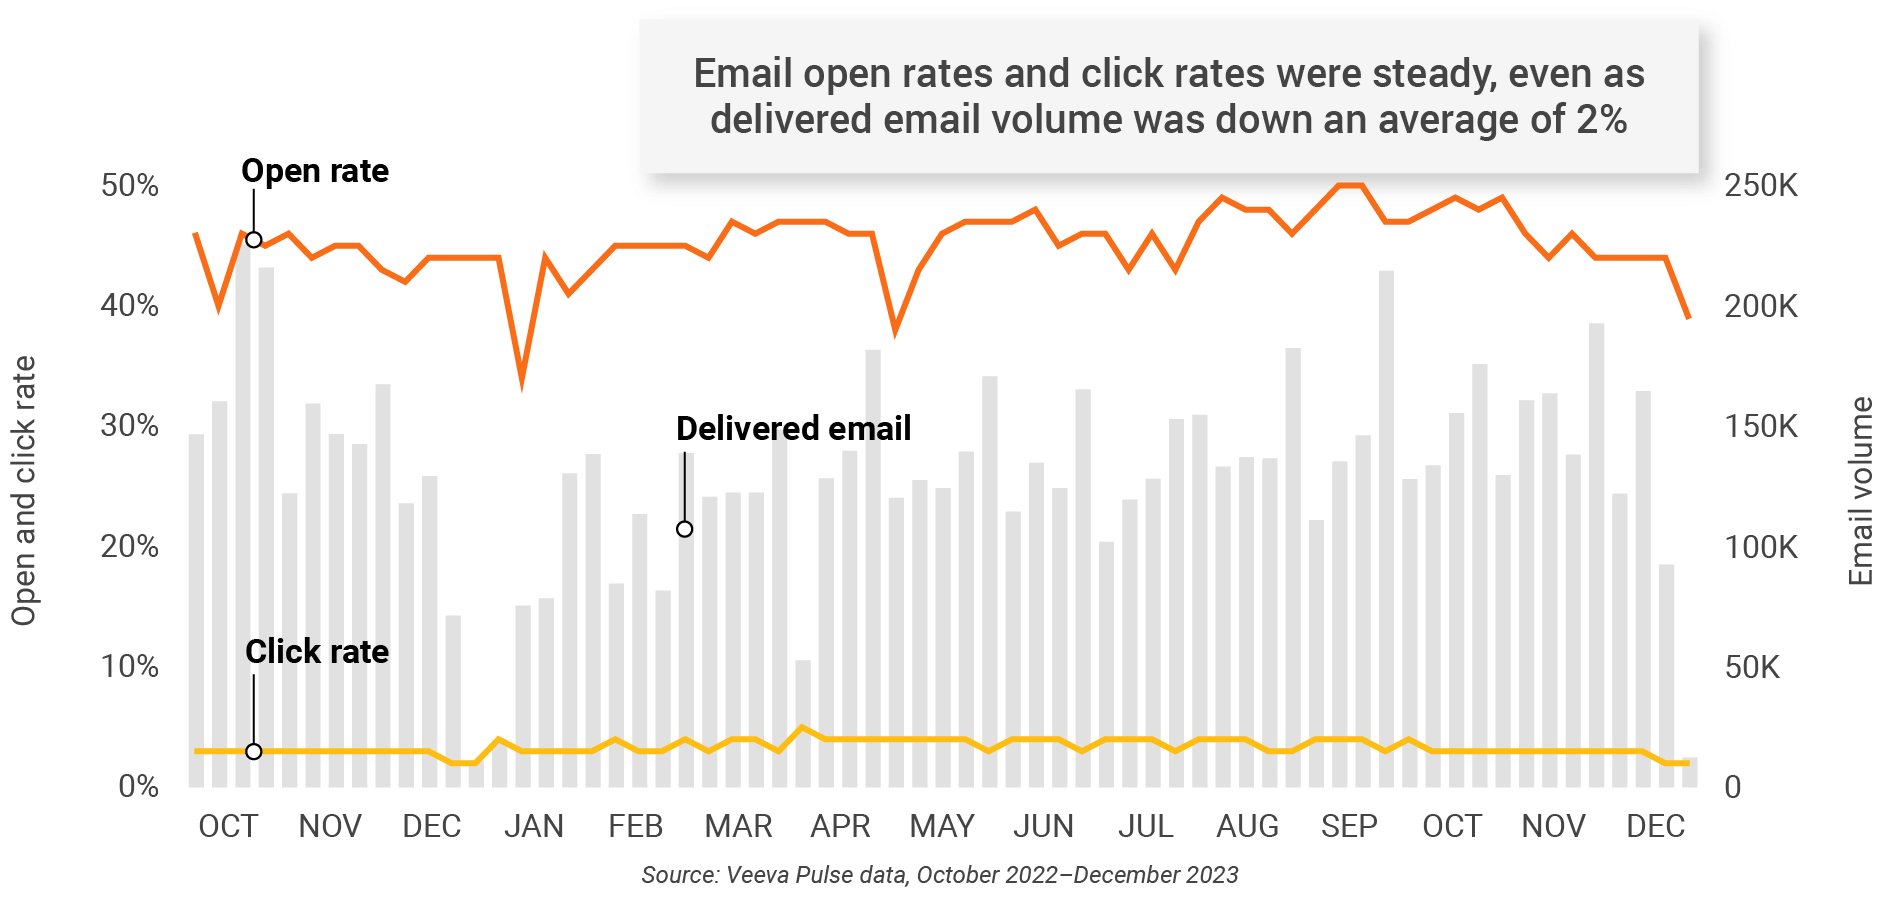
Figure 39: Content usage by channel, Latin America
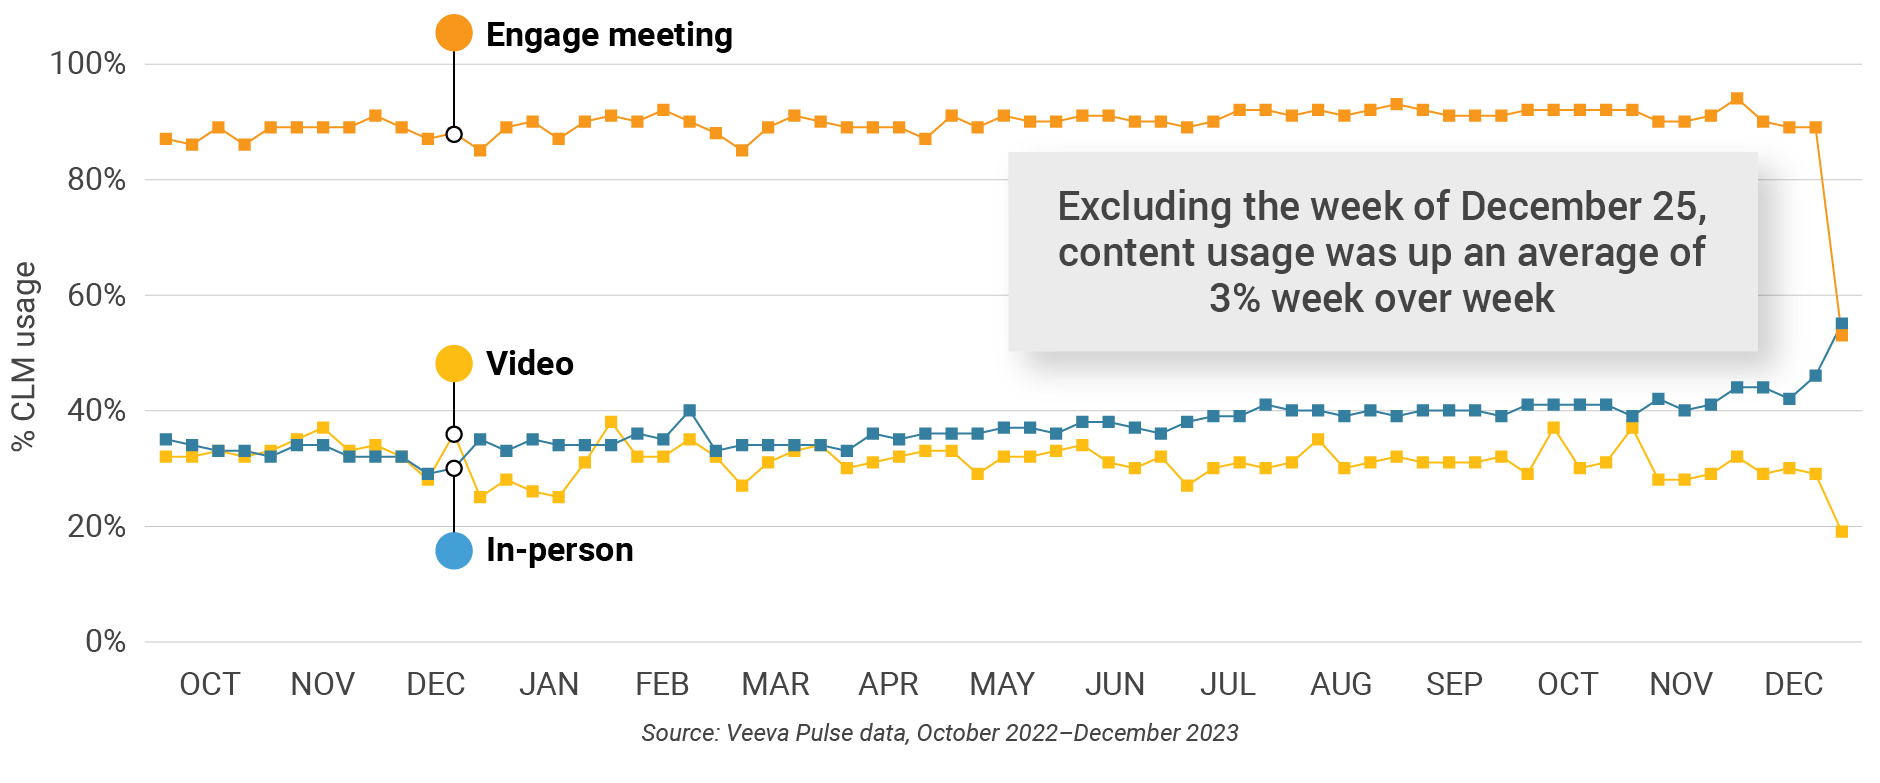
Figure 40: Veeva CRM Engage meeting duration, Latin America

Appendix: Data dictionary
Metric definitions
- Channel mix evolution over time: Weekly Veeva CRM activity volume broken down by the channel of engagement (in-person, phone, video, email, chat, or text)
- Channel mix: Total Veeva CRM activity volume broken down by engagement channel percentage
- Weekly activities per user: The average weekly number of Veeva CRM activities submitted per number of users active in Veeva CRM
- Approved email volume: Volume of approved emails sent via Veeva CRM
- Email open rate: Percentage of approved emails opened at least once out of all approved emails sent via Veeva CRM
- Email click rate: Percentage of approved emails clicked at least once out of all approved emails sent via Veeva CRM
- In-person % CLM usage: Percentage of in-person engagements that leveraged content in Veeva CRM
- Video % CLM usage: Percentage of video engagements that leveraged content in Veeva CRM
- Veeva CRM Engage meeting % CLM usage: Percentage of Veeva CRM Engage meetings that leveraged content in Veeva CRM
- Veeva CRM Engage meeting duration: The average duration of Veeva CRM Engage meetings in minutes
Engagement channel definitions
- In-person: Submitted calls with a CRM Standard Metrics call channel value of ‘in-person’
- Phone: Submitted calls with a CRM Standard Metrics call channel value of ‘phone’
- Video: Veeva CRM Engage calls and video calls via other platforms that are then recorded as calls in Veeva CRM with a Standard Metrics call channel value of ‘video’
- Email: Approved emails and emails sent via other platforms that are then recorded as calls in Veeva CRM with a Standard Metrics call channel value of ‘email’
- Chat or text: Submitted calls with a CRM Standard Metrics call channel value of ‘chat or text’
User type definitions
- Sales: Users that have been classified with the ‘sales’ value in the CRM Standard Metrics user type field
- Key account manager: Users that have been classified with the ‘key account manager’ value in the CRM Standard Metrics user type field
- Medical: Users that have been classified with the ‘medical’ value in the CRM Standard Metrics user type field
- Top global biopharma: Top 17 global biopharma companies by revenue
- Rest of industry: All other biopharmas
Region definitions
- Global: All markets globally
- Europe: Albania, Andorra, Armenia, Aruba, Austria, Azerbaijan, Belarus, Belgium, Bermuda, Bosnia and Herzegovina,
Bulgaria, Croatia, Cyprus, Czech Republic, Denmark, Estonia, Finland, France, French Polynesia, Georgia, Germany,
Greece, Greenland, Guadeloupe, Guernsey, Hungary, Ireland, Italy, Jersey, Latvia, Lithuania, Luxembourg, Macedonia,
Malta, Martinique, Republic of Moldova, Monaco, Montenegro, Netherlands, New Caledonia, Norway, Poland, Portugal,
Romania, Serbia, Slovakia, Slovenia, Spain, Sweden, Switzerland, Ukraine, United Kingdom - Asia: Australia, Bangladesh, Bhutan, Brunei Darussalam, Cambodia, Cocos (Keeling) Islands, Indonesia, Japan,
Kazakhstan, Republic of Korea, Kyrgyzstan, Malaysia, Mongolia, Myanmar, Nauru, Nepal, New Zealand, Philippines,
Samoa, Singapore, Solomon Islands, Sri Lanka, Taiwan, Tajikistan, Thailand, Turkmenistan, Uzbekistan, Vietnam - Latin America: Antigua and Barbuda, Argentina, Bahamas, Barbados, Belize, Bolivia, Brazil, Chile, Colombia, Costa
Rica, Cuba, Dominican Republic, Ecuador, El Salvador, Guatemala, Guyana, Haiti, Honduras, Jamaica, Mexico,
Nicaragua, Panama, Paraguay, Peru, Trinidad and Tobago, Uruguay, Venezuela
Methodology
The Veeva Pulse Field Trends Report is a quarterly industry benchmark for global and regional healthcare professional
(HCP) engagement across the life sciences industry. The report is based on proprietary Veeva Pulse data and insights
from field engagement activities of more than 80% of all industry representatives worldwide (Asia Pacific, Europe, Latin
America, and the United States). Veeva CRM Standard Metrics — now used industrywide — provide the basis for
consistent collection and measurement of engagement KPIs including channel mix and productivity across regions,
roles, and market segments. The findings are based on:
- Approximately 600 million annual global field activities captured in Veeva CRM and Veeva CRM Engage
- 70 billion prescription (Rx) and medical (Mx) records captured in Veeva Compass Patient, U.S.-specific anonymous patient longitudinal data, including prescriptions, procedures, and diagnoses
- 3+ million profiles containing publications, clinical trials, conferences, associations, guidelines, grants, payments, social media, news mentions, and influence on community practice from Veeva Link Key People across 85+ countries and 24 therapeutic areas
- Global reference data of healthcare professionals, healthcare organizations, and affiliations from Veeva OpenData, containing addresses, emails, specialties, demographics, and compliance data (license information and industry identifiers) available in 100+ countries today and 115+ countries by the end of 2024
The Veeva Pulse Field Trends Report delivers insights that inform the industry and help field teams align their strategy to
key market trends for improved commercial success. The global Veeva Business Consulting team also helps customers
inform their strategies using industry benchmarking with Veeva Pulse data.
