Trends Improving HCP Engagement and Accelerating
Treatment Adoption
Veeva Pulse data shows that when commercial teams deliver connected, coordinated scientific
information and resources, it deepens HCP relationships, mitigates challenging access, and improves
treatment adoption. But HCPs say biopharmas aren’t consistently delivering a connected experience.
More than half of key opinion leaders1 engage with clinical, medical, and sales teams, but 44%
see a lack of coordination and alignment between them. Conflicting information, siloed interactions,
and missed opportunities prevent teams from delivering on HCPs’ needs as one company.
“Some companies give the impression that they work very well together, know
each other, and know what they are selling and developing. At the same time,
we see completely the opposite. They don’t know each other — the medical part
of the company doesn’t know anything about sales, and vice versa.”
— Dr. Vital Hevia, Urologist and Robotic Surgeon, ROC Clinic and HM Hospitals
See how Veeva Pulse insights from the past year are helping commercial teams respond quickly to HCPs’ needs and improve treatment adoption.

Dan Rizzo
VP, Global Head of Business Consulting

1 Veeva Survey of 50 Key Opinion Leaders, September-November 2024.
Pre-launch scientific outreach is accelerating treatment
adoption by 40%
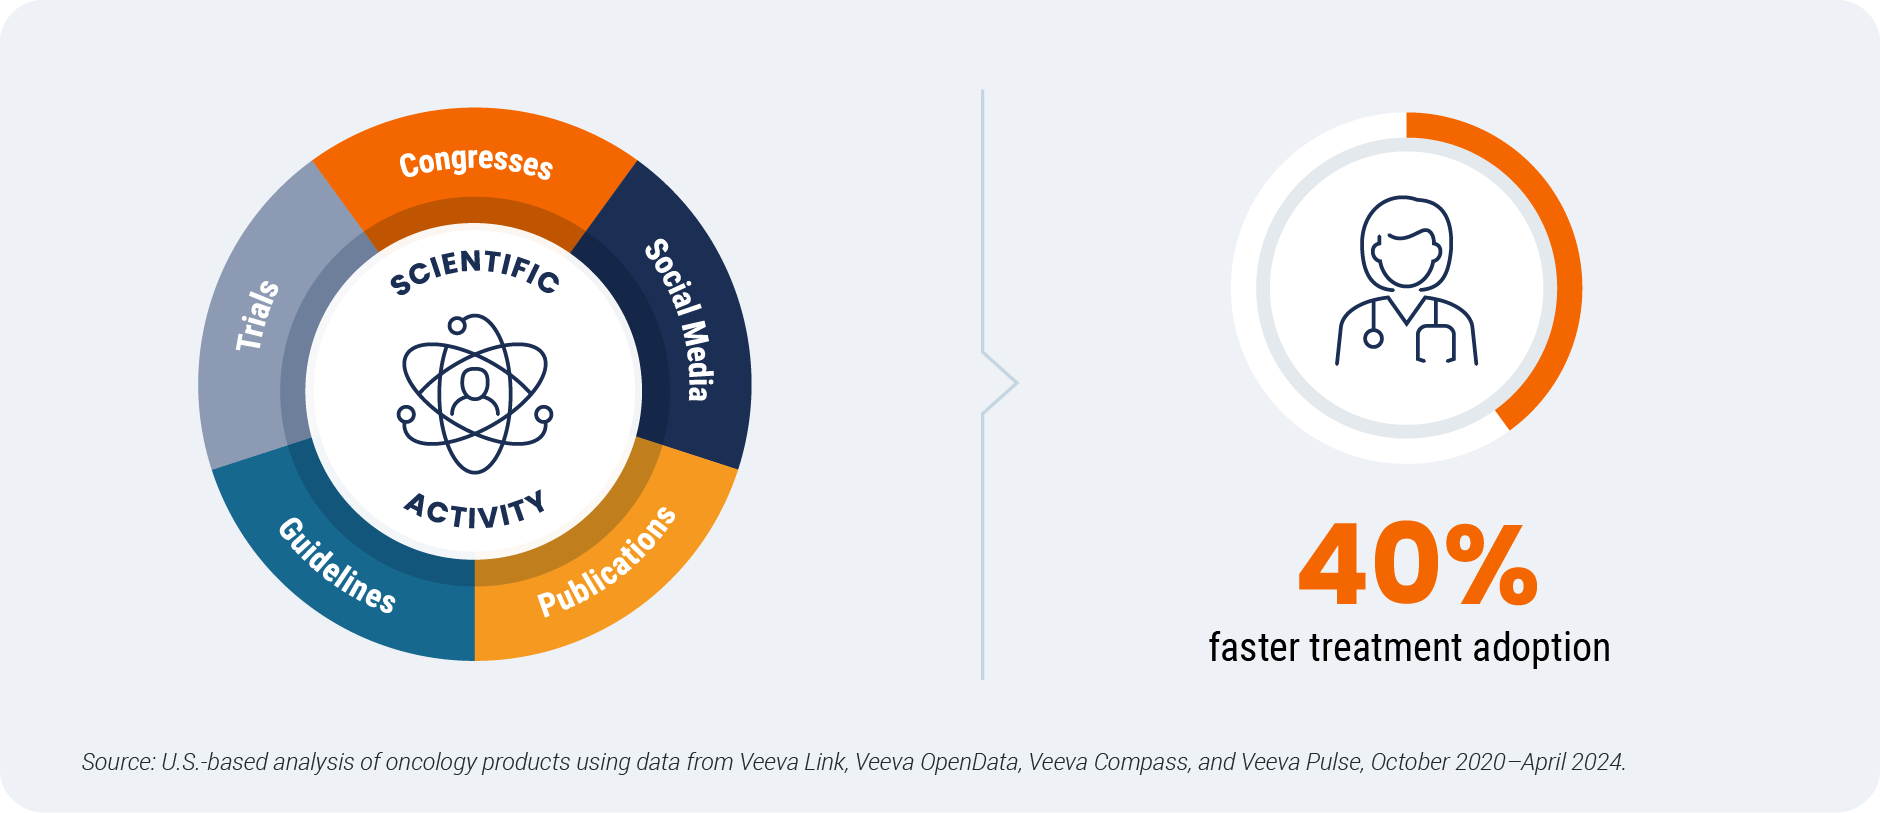
Prioritizing investments in targeted scientific activities with the right experts speeds treatment adoption. A U.S.-based study of oncology drugs showed
that biopharmas who invested more in pre-launch scientific activities saw
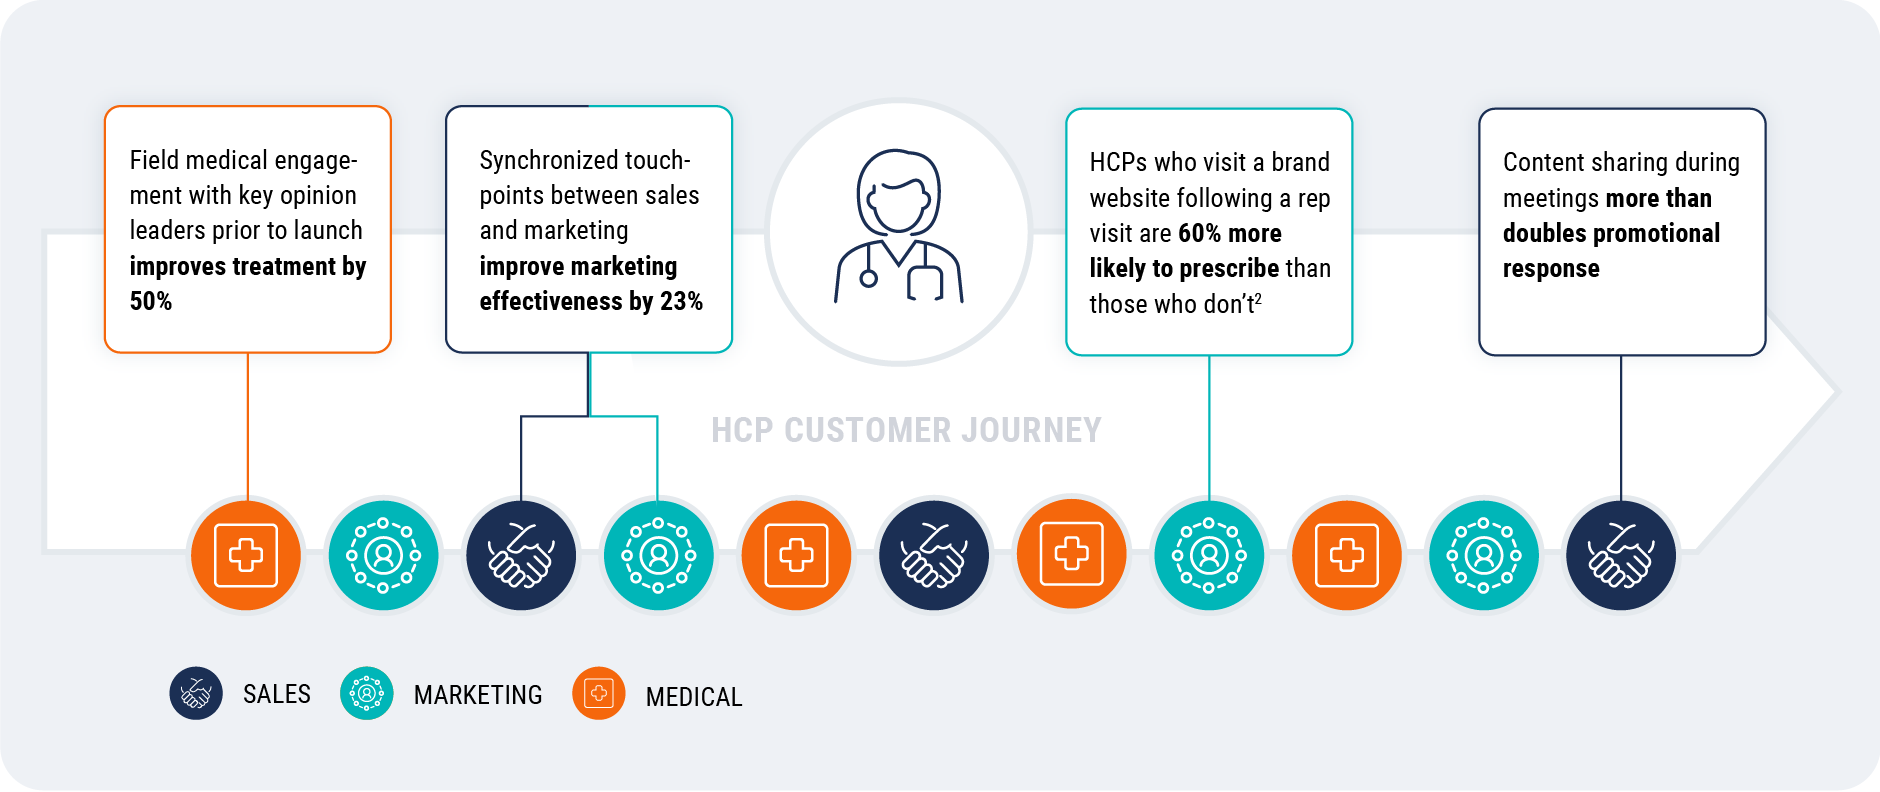
40% faster treatment adoption than companies that invested less. Field medical engagement with key opinion leaders prior to launch also improves treatment adoption by 50%.
Where companies make investments matters. In the same study, congress activity had the strongest influence on speed of adoption, outpacing the influence of social media, publications, guidelines, and clinical trials. Medical teams should also focus engagement on digitally savvy, early-career HCPs, who are four times more likely to adopt a new treatment.
Synchronized sales and marketing is
improving prescribing behavior
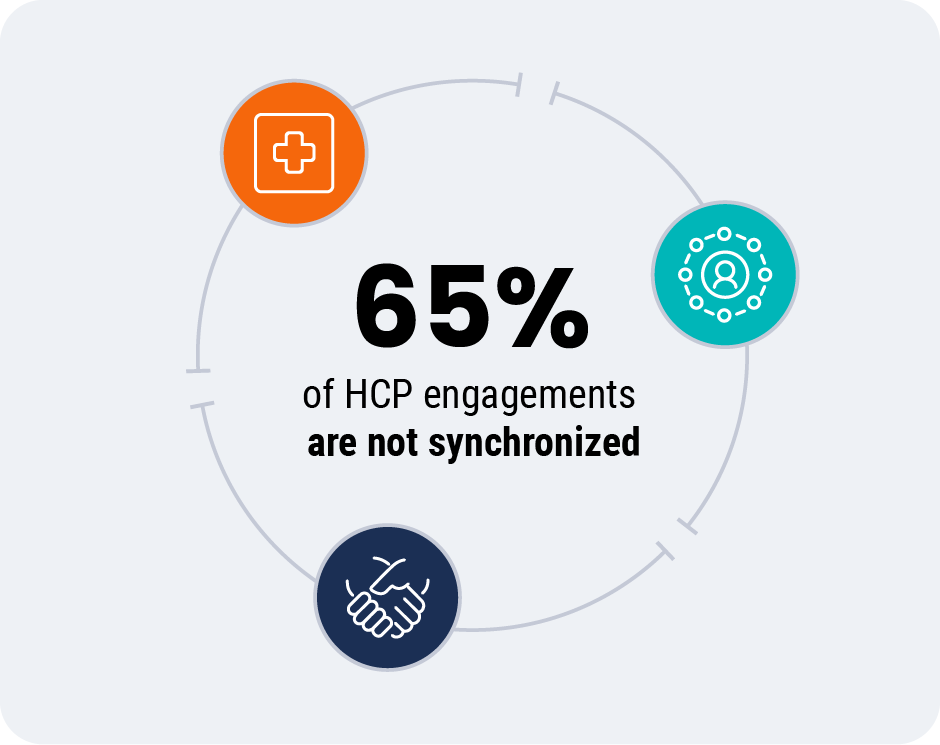
Close and timely coordination of field engagements and HCP digital advertising — or synchronization — increases marketing effectiveness by 23%. But 65% of HCP engagements are not synchronized.
Coordinating sales and marketing touchpoints can close the gap, strengthening HCP engagement, increasing scientific understanding, and improving prescribing behavior. In one case study, a rep call was 30% more likely to result in a prescription if it was followed by digital exposure within 10 days.2 Another showed that HCPs exposed to digital ads within 10 days after a speaker program were 25% more likely to prescribe.2
“A person’s capacity to ingest content that is not relevant,
not timely, and not delivered in a way that they want to receive
it is probably something like zero. And our job as marketers is
to figure out how to get as close as possible to relevant, timely, and needed content at the right time.”
— Erica Taylor, PhD, Vice President, Chief Marketing Officer, Genentech
Connected engagement across sales, marketing, and medical3
2 Source: U.S. Veeva Crossix case studies and Veeva Pulse data, 2023 and 2024.
3 Simplified representation of the connected engagement model
Timely, relevant engagement is mitigating declining access
HCP access declined from 60% to 45% from 2023 to 2024 in the U.S., marking a return to prepandemic
levels. Access levels vary significantly by specialty — oncology, internal medicine, and psychiatry are the
most difficult to reach. And HCPs are highly selective, with 50% of accessible HCPs limiting engagement
to three or fewer companies.
Connected sales, marketing, and medical teams are mitigating challenging access by extending
conversations, responding quickly to HCPs’ needs, and improving treatment adoption. This commercial
model requires shared data, connected systems, aligned incentives, and a unified understanding of
the customer.
“How do we get a better understanding of our customers and make sure
that our messages and the way we approach people is relevant, meaningful,
and treating them as the unique individuals they are, rather than just saying,
‘I’m going to use the same five slides.’”
— Kieron Scrutton, SVP Medical Affairs Digital & Technology, and Tech Governance Risk
and Compliance, GSK
Connect with Veeva Business Consulting to learn how Veeva Pulse data can improve HCP
engagement for your field team.
Global and Regional Trends
This report highlights global and regional field engagement trends from Veeva Pulse data gathered between October
2023 and December 2024. Veeva Pulse data is sourced from Veeva’s aggregated CRM activity, including field
engagement stats from all instances of Veeva CRM globally. In this report, comparisons in trending charts are year
over year, Q4 2023 to Q4 2024, while non-trending charts contain quarter-over-quarter comparisons, Q3 2024 to Q4
2024.
Global trends*
Figure 1: Channel mix evolution, global
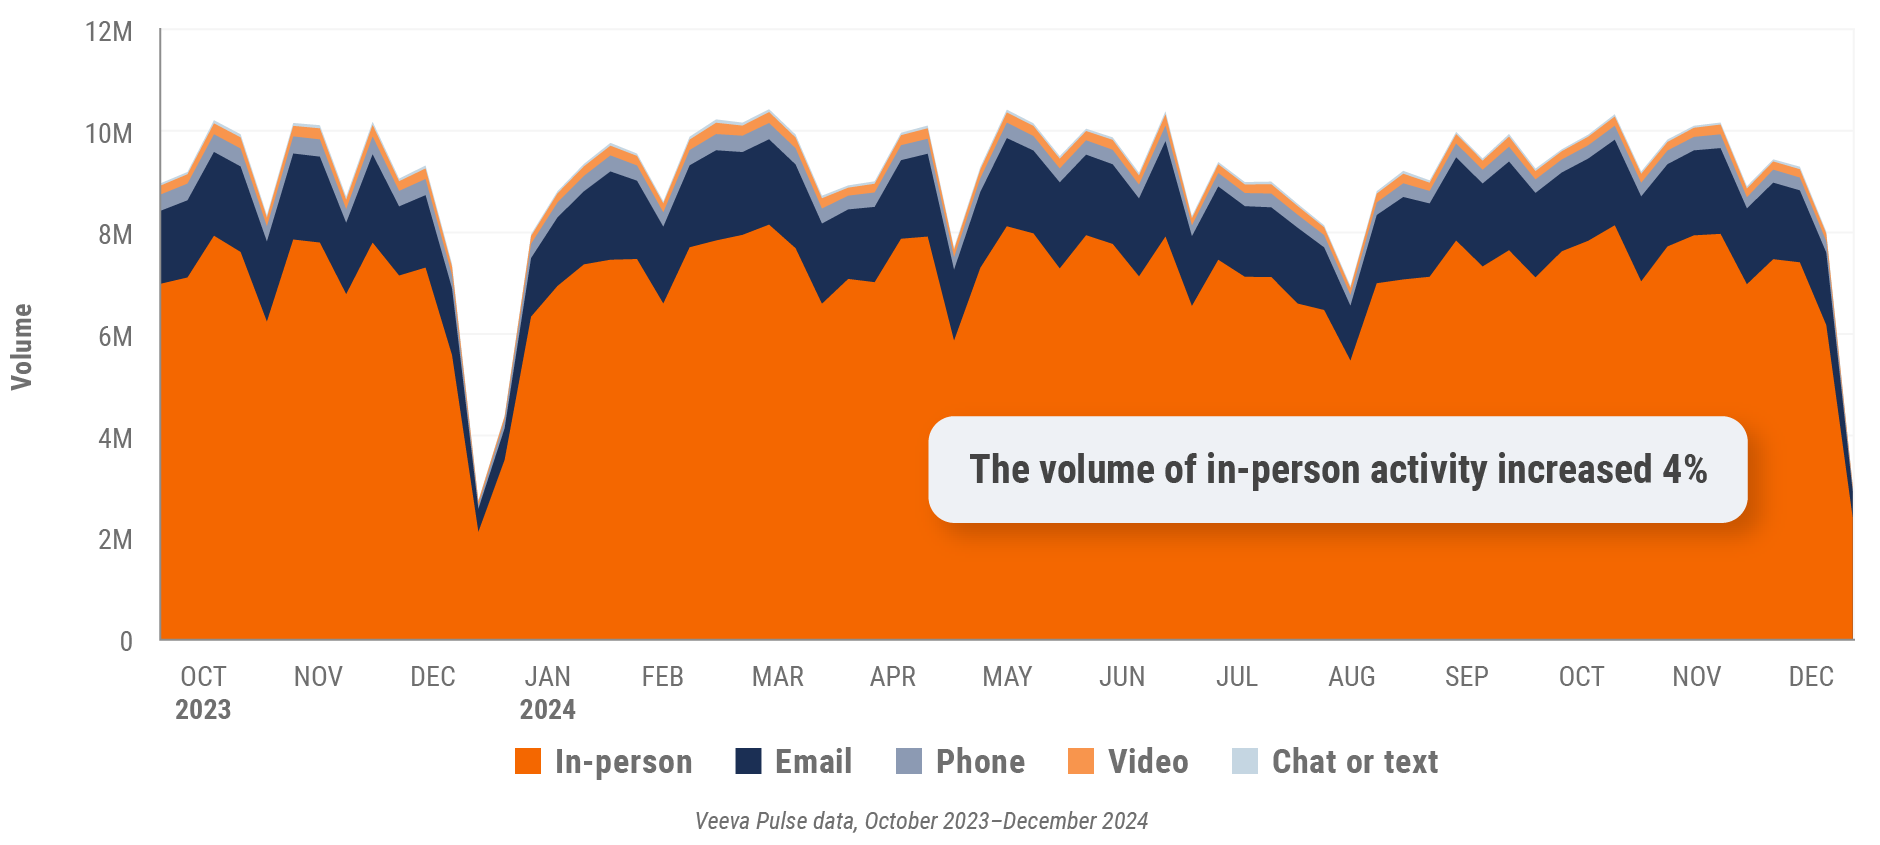
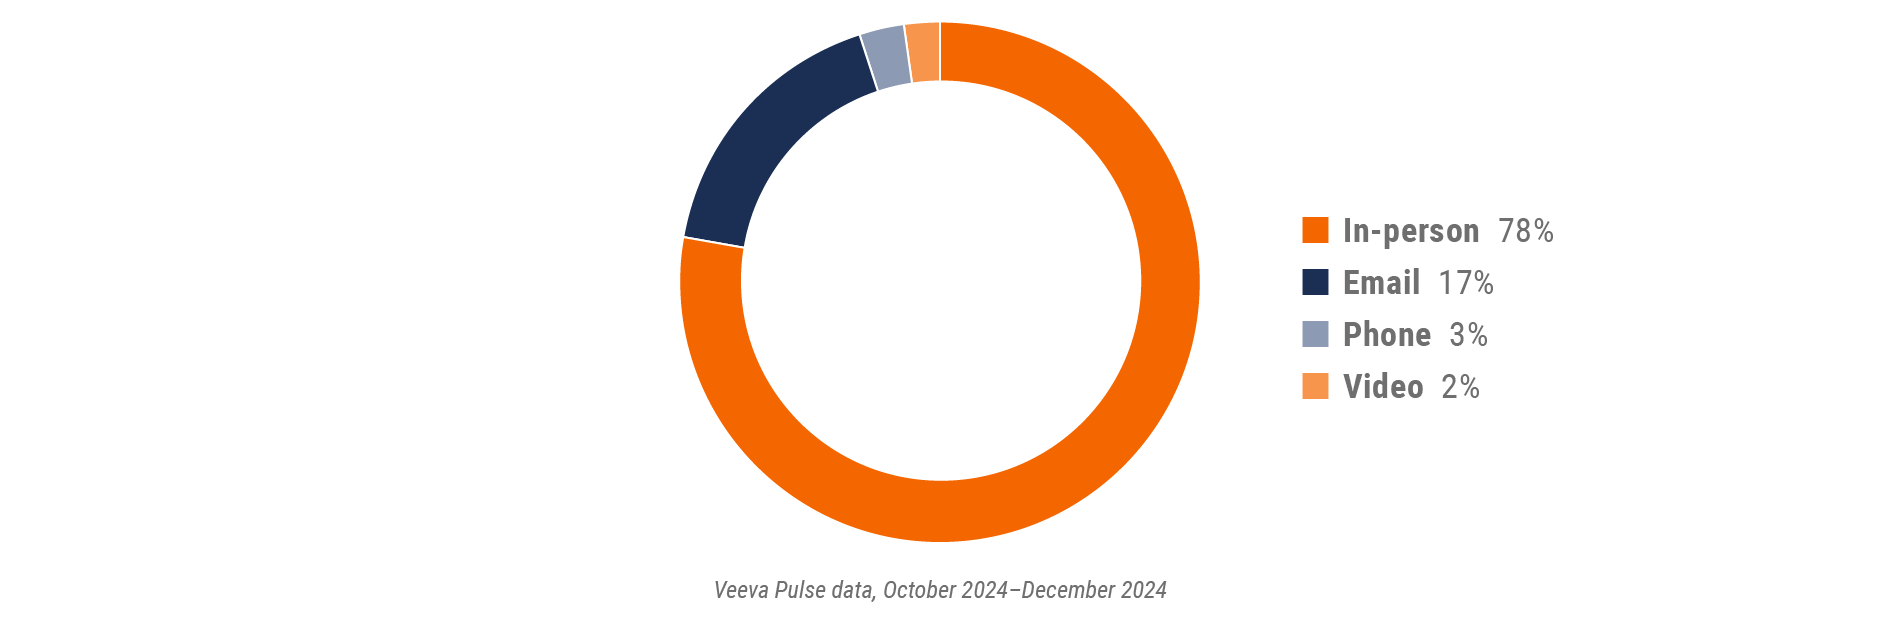
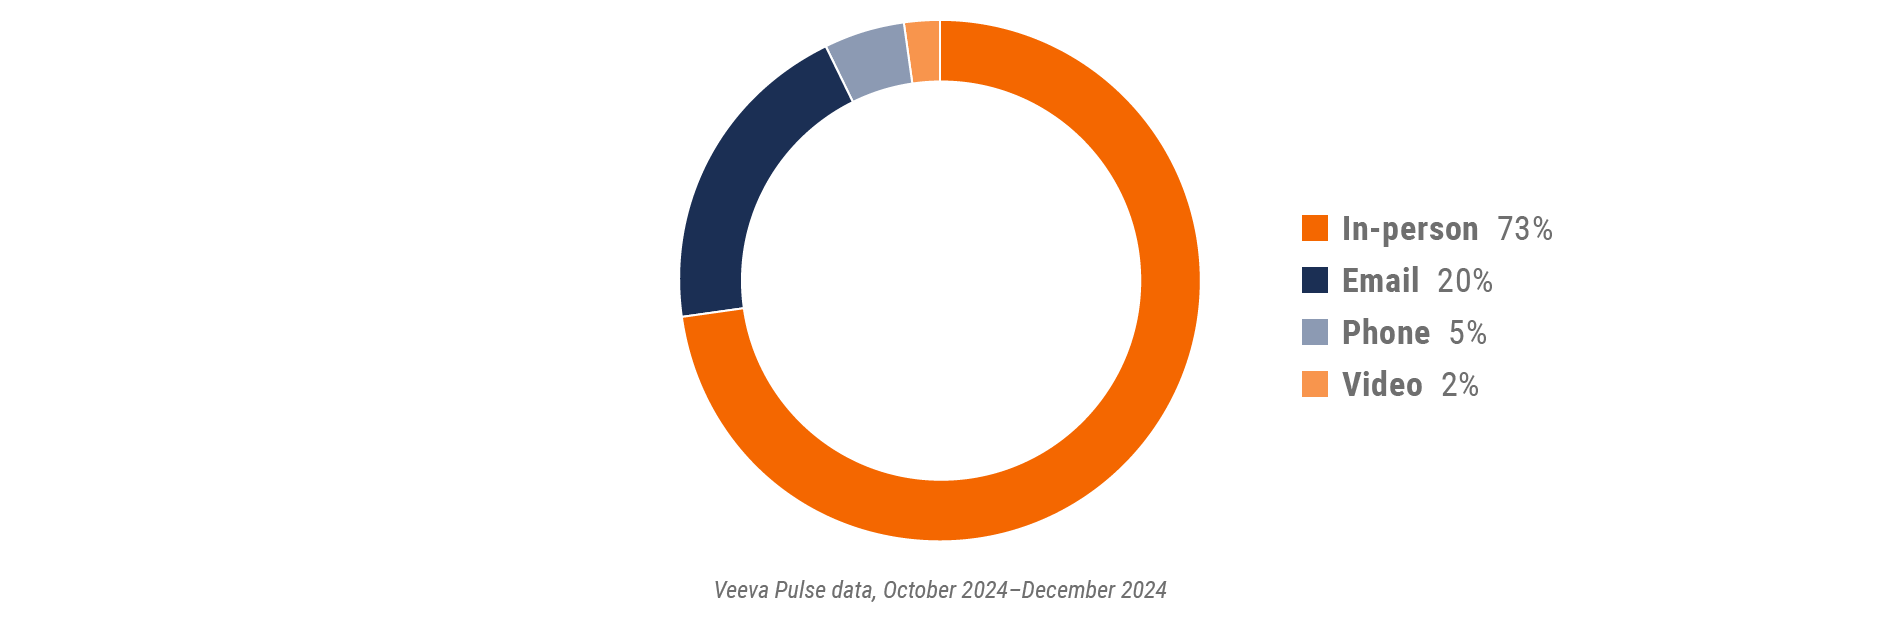
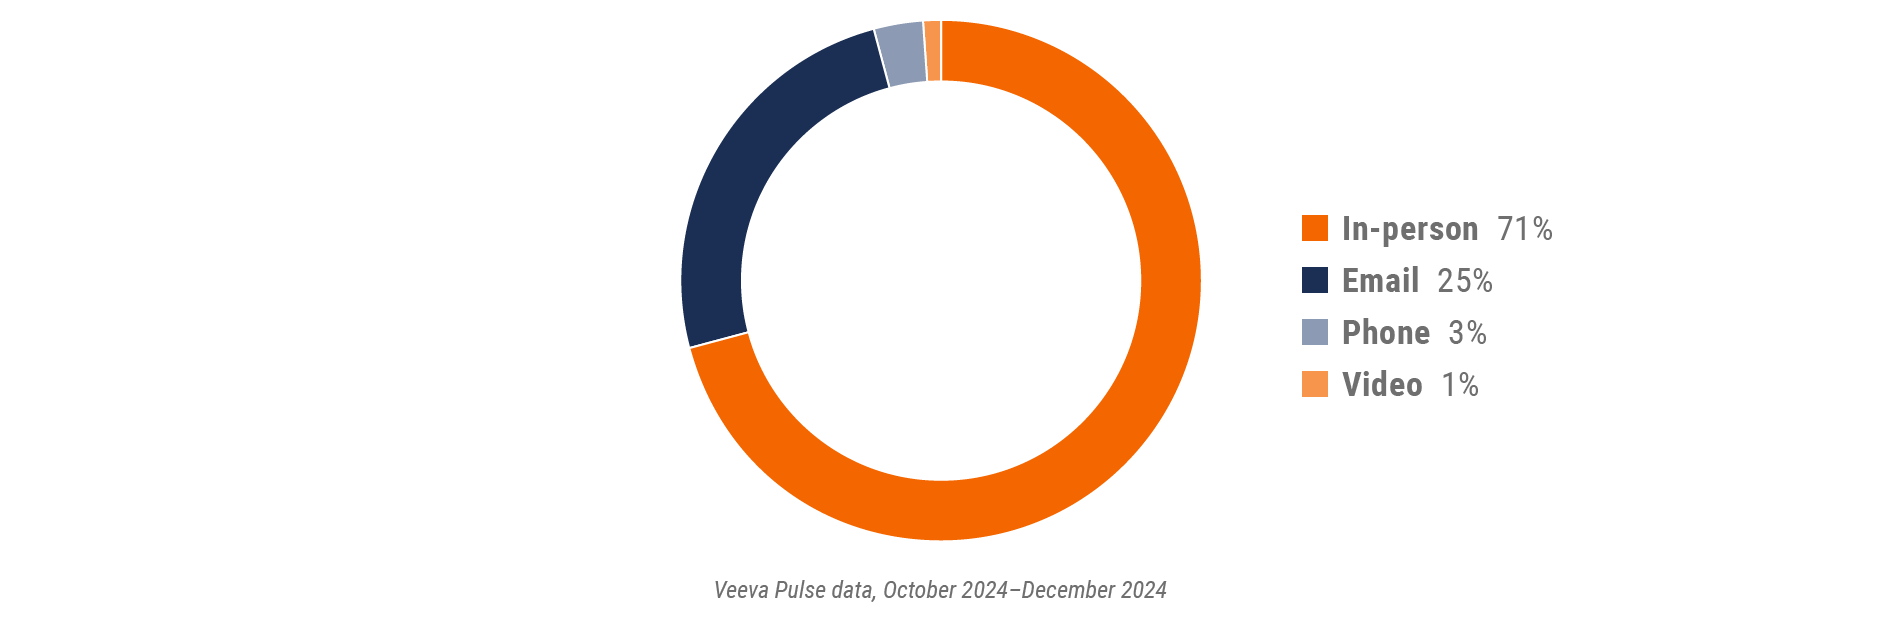
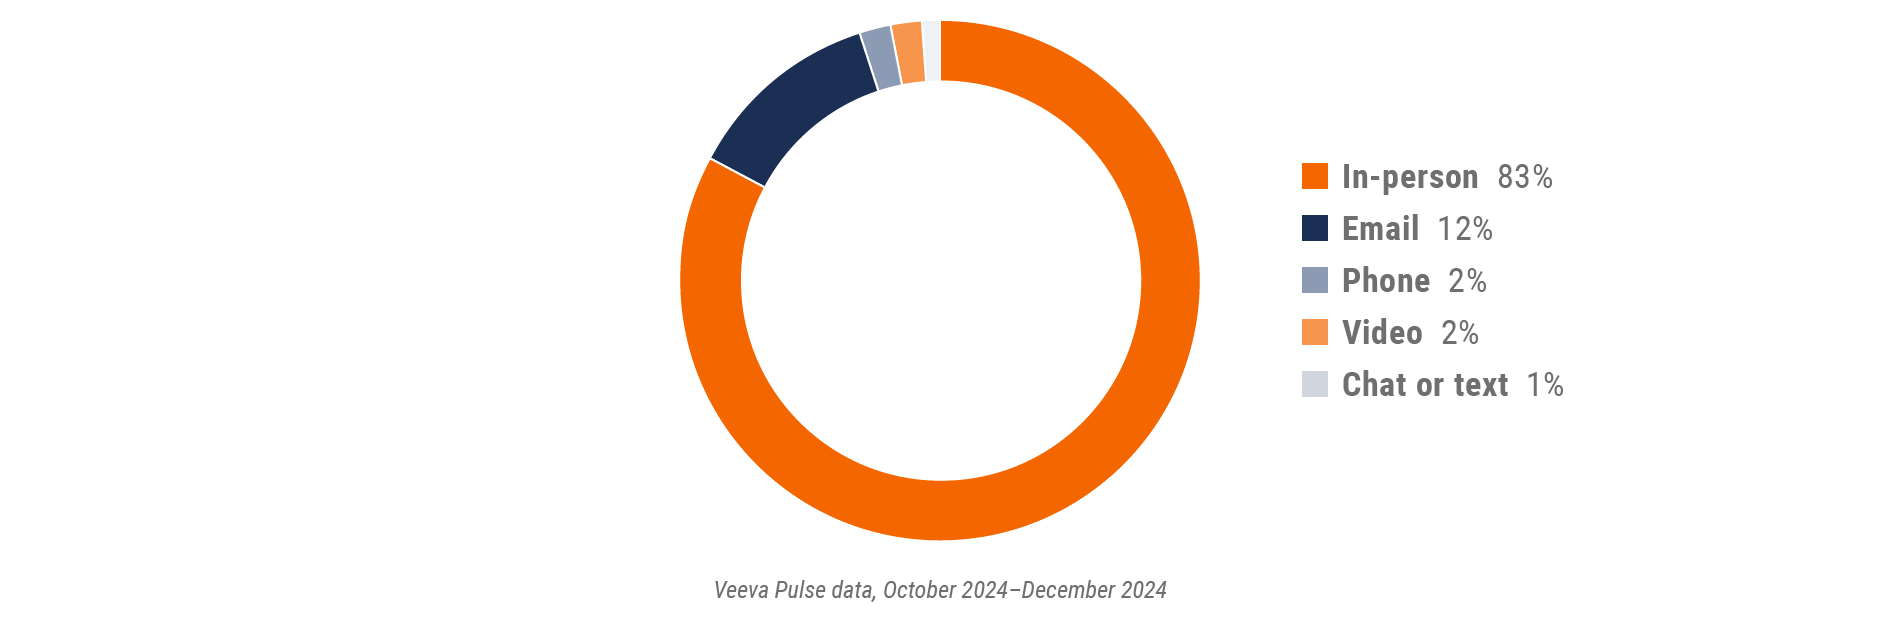
Figure 2: Channel mix, global
Global field team activity
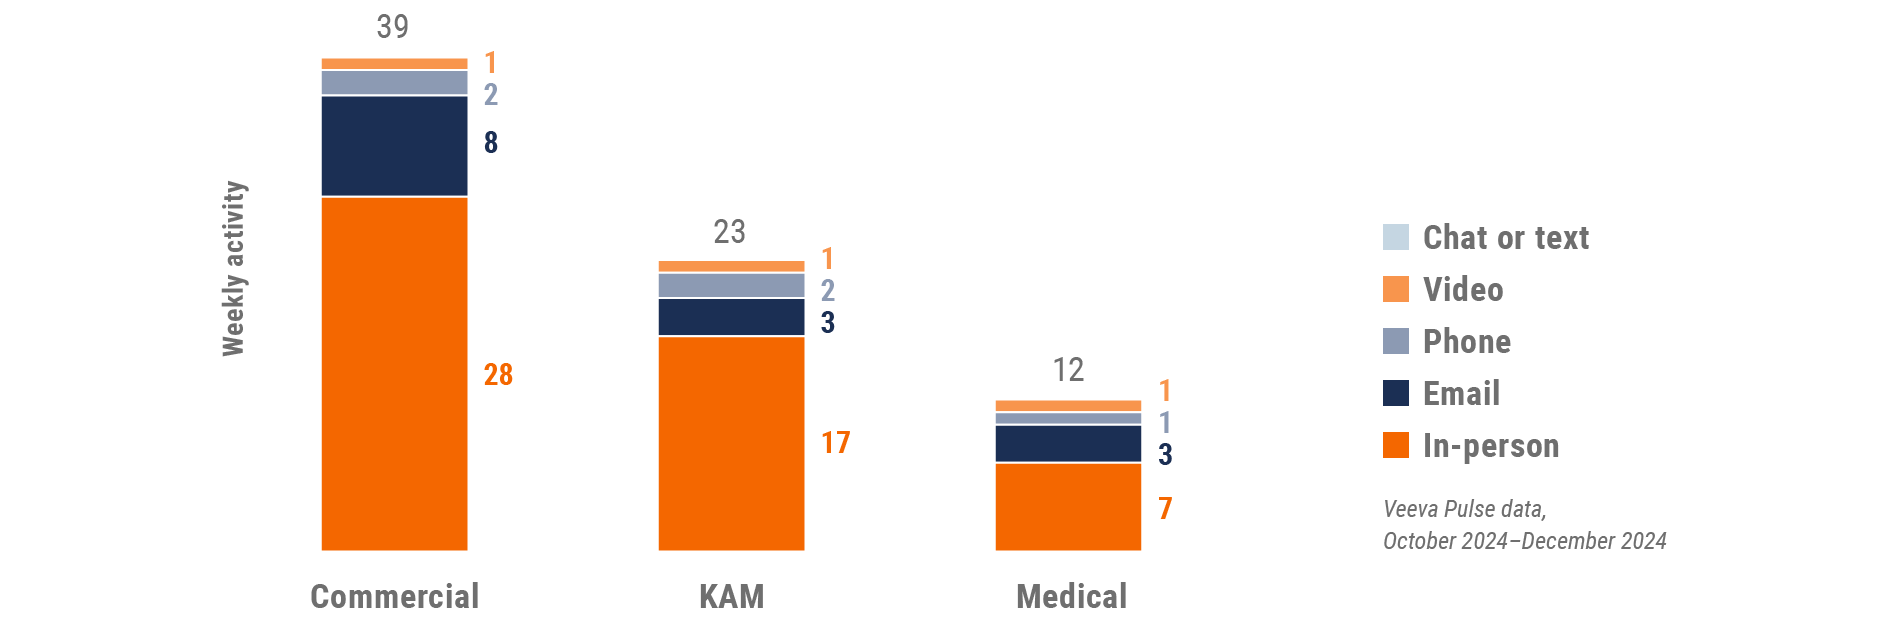
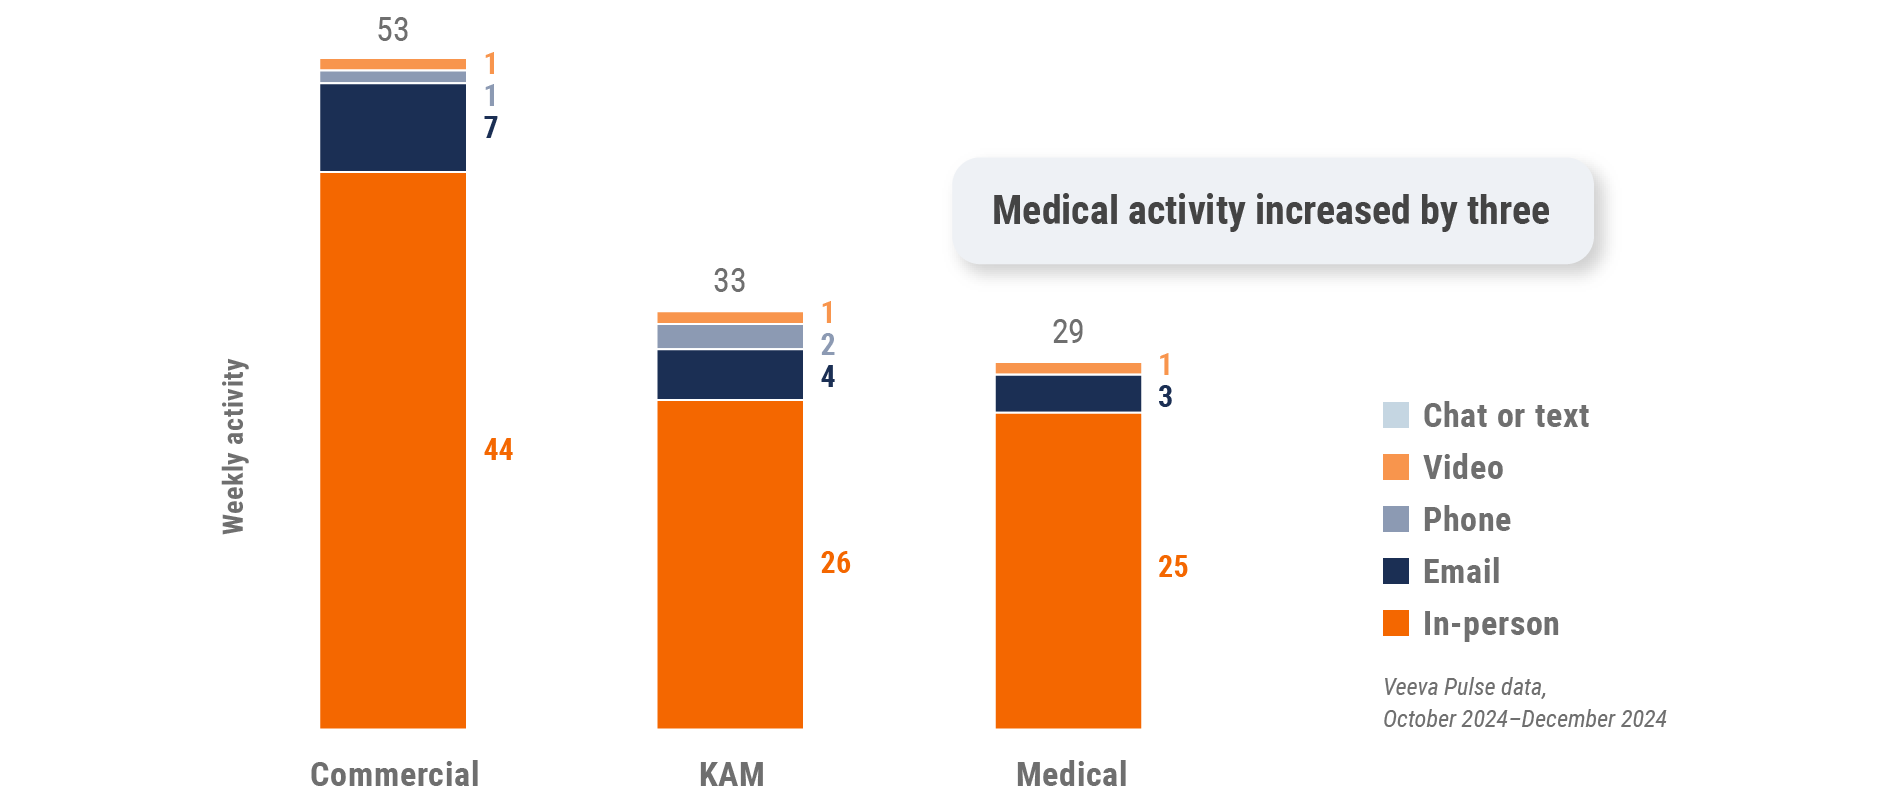
Weekly activity per user by engagement channel
Figure 3: Activity by region, global
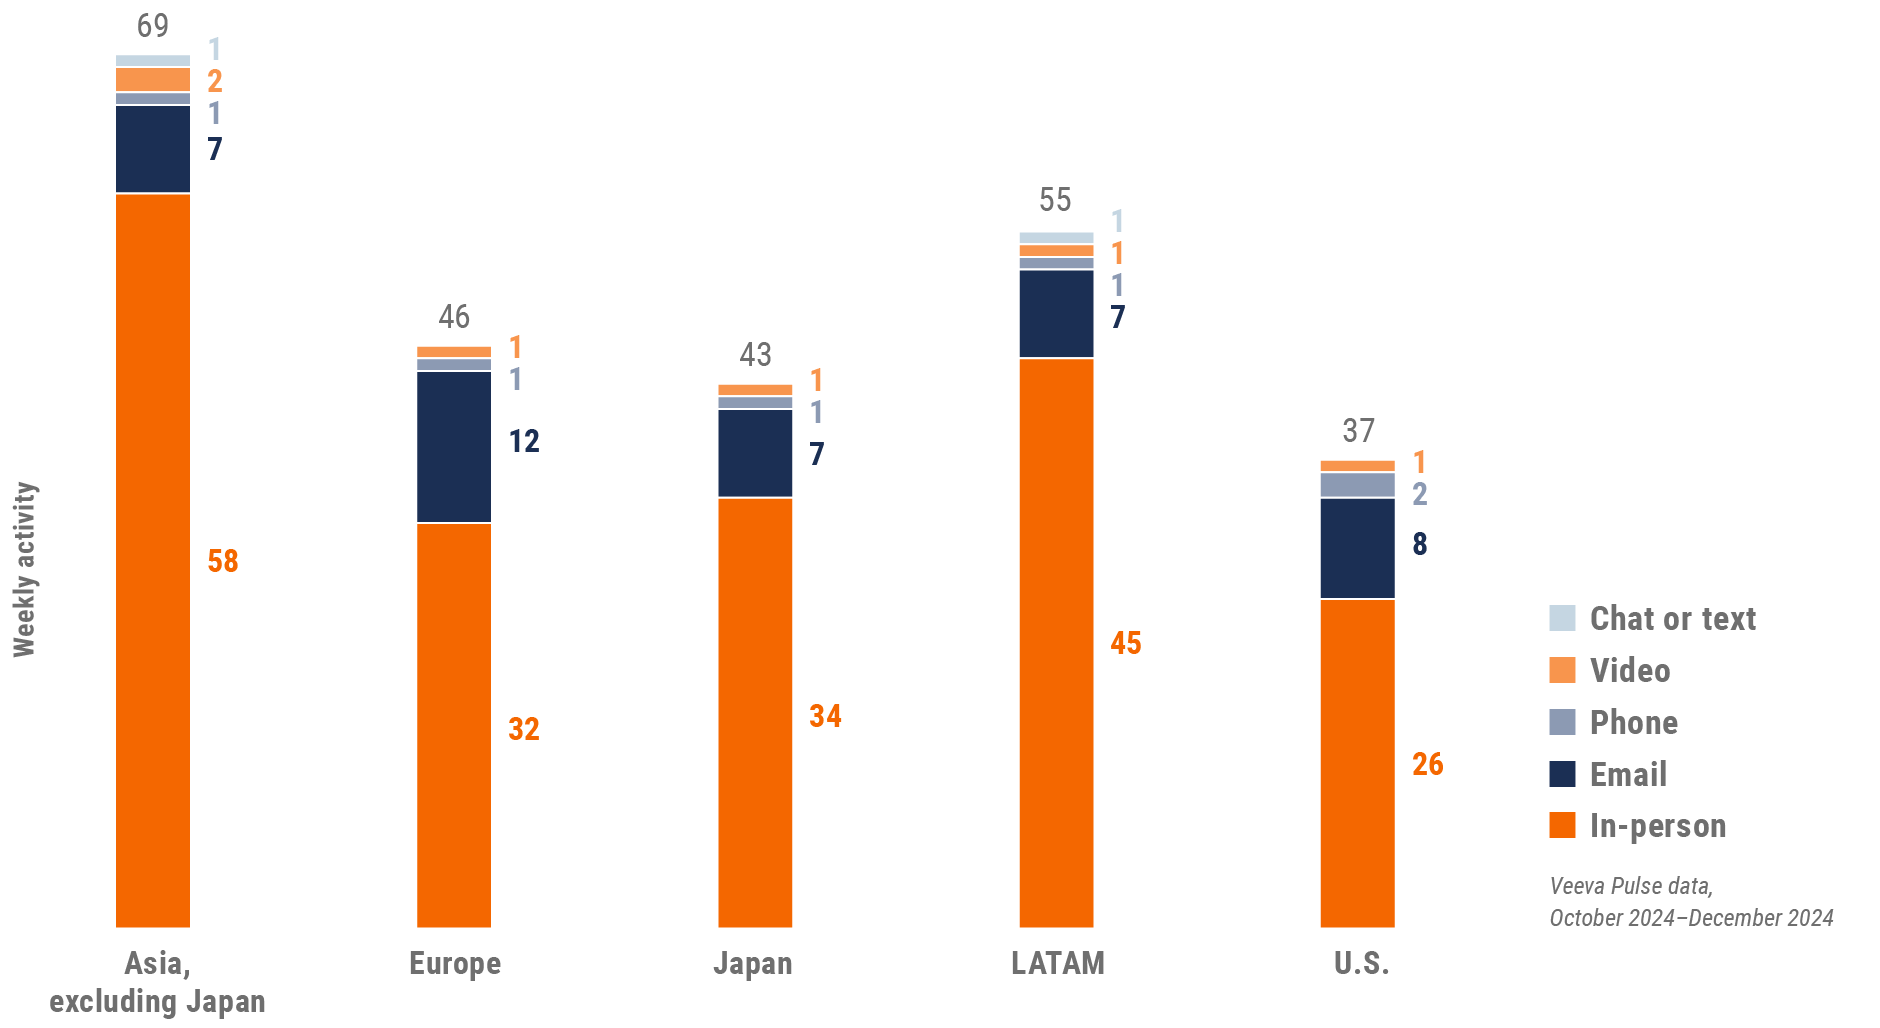
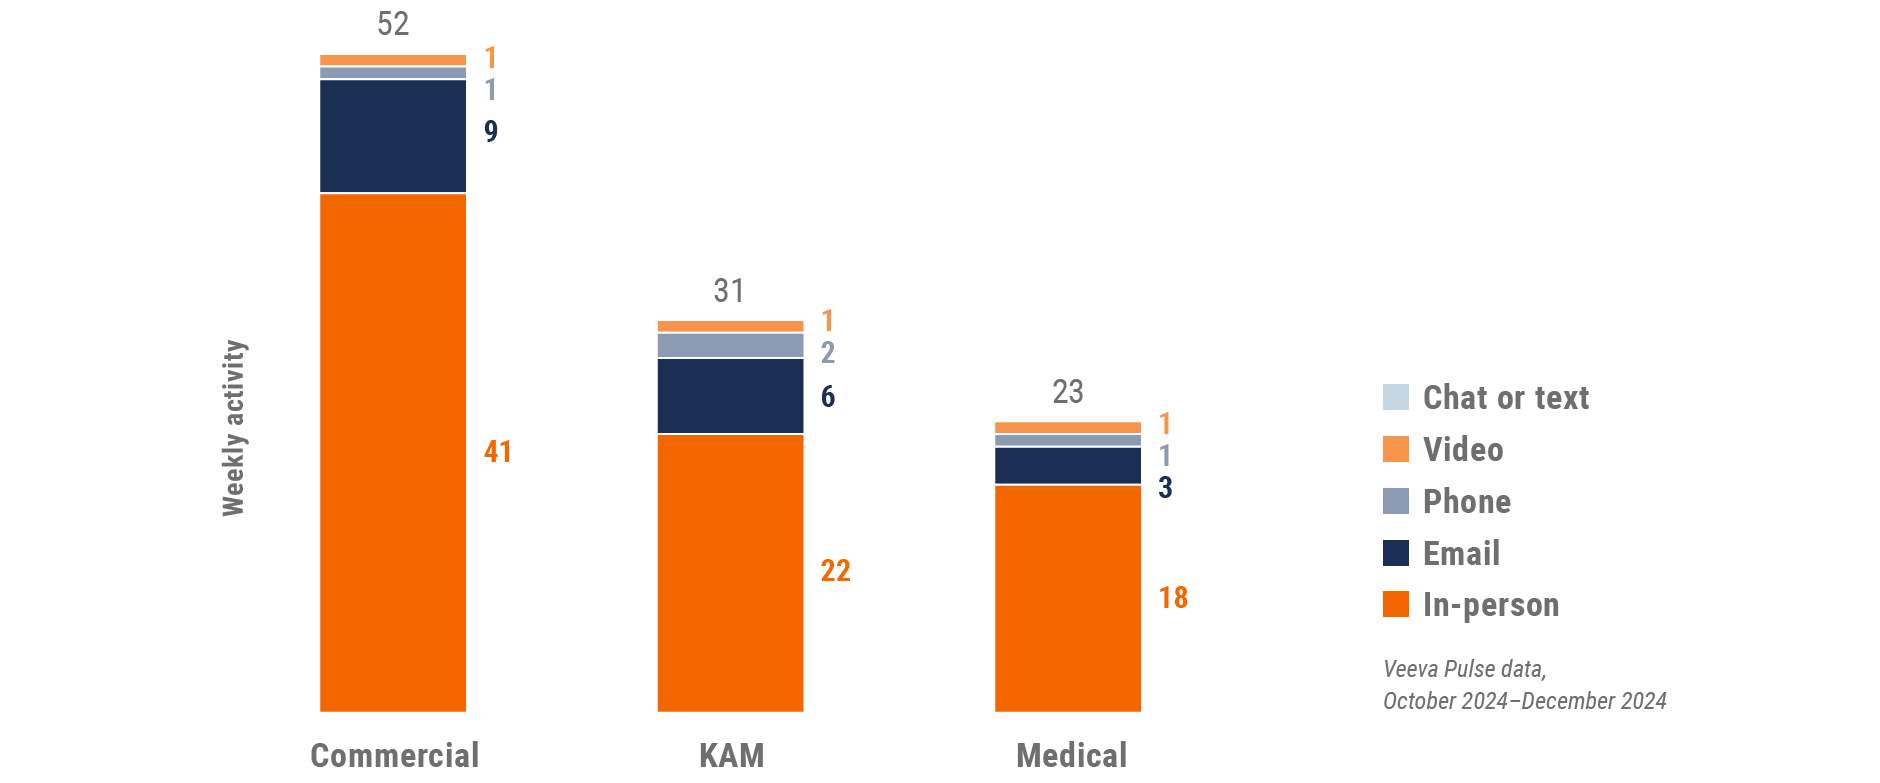
Figure 4: Activity by user type, global
Global engagement quality
Consolidation of key quality metrics
Figure 5: Approved email volume, global
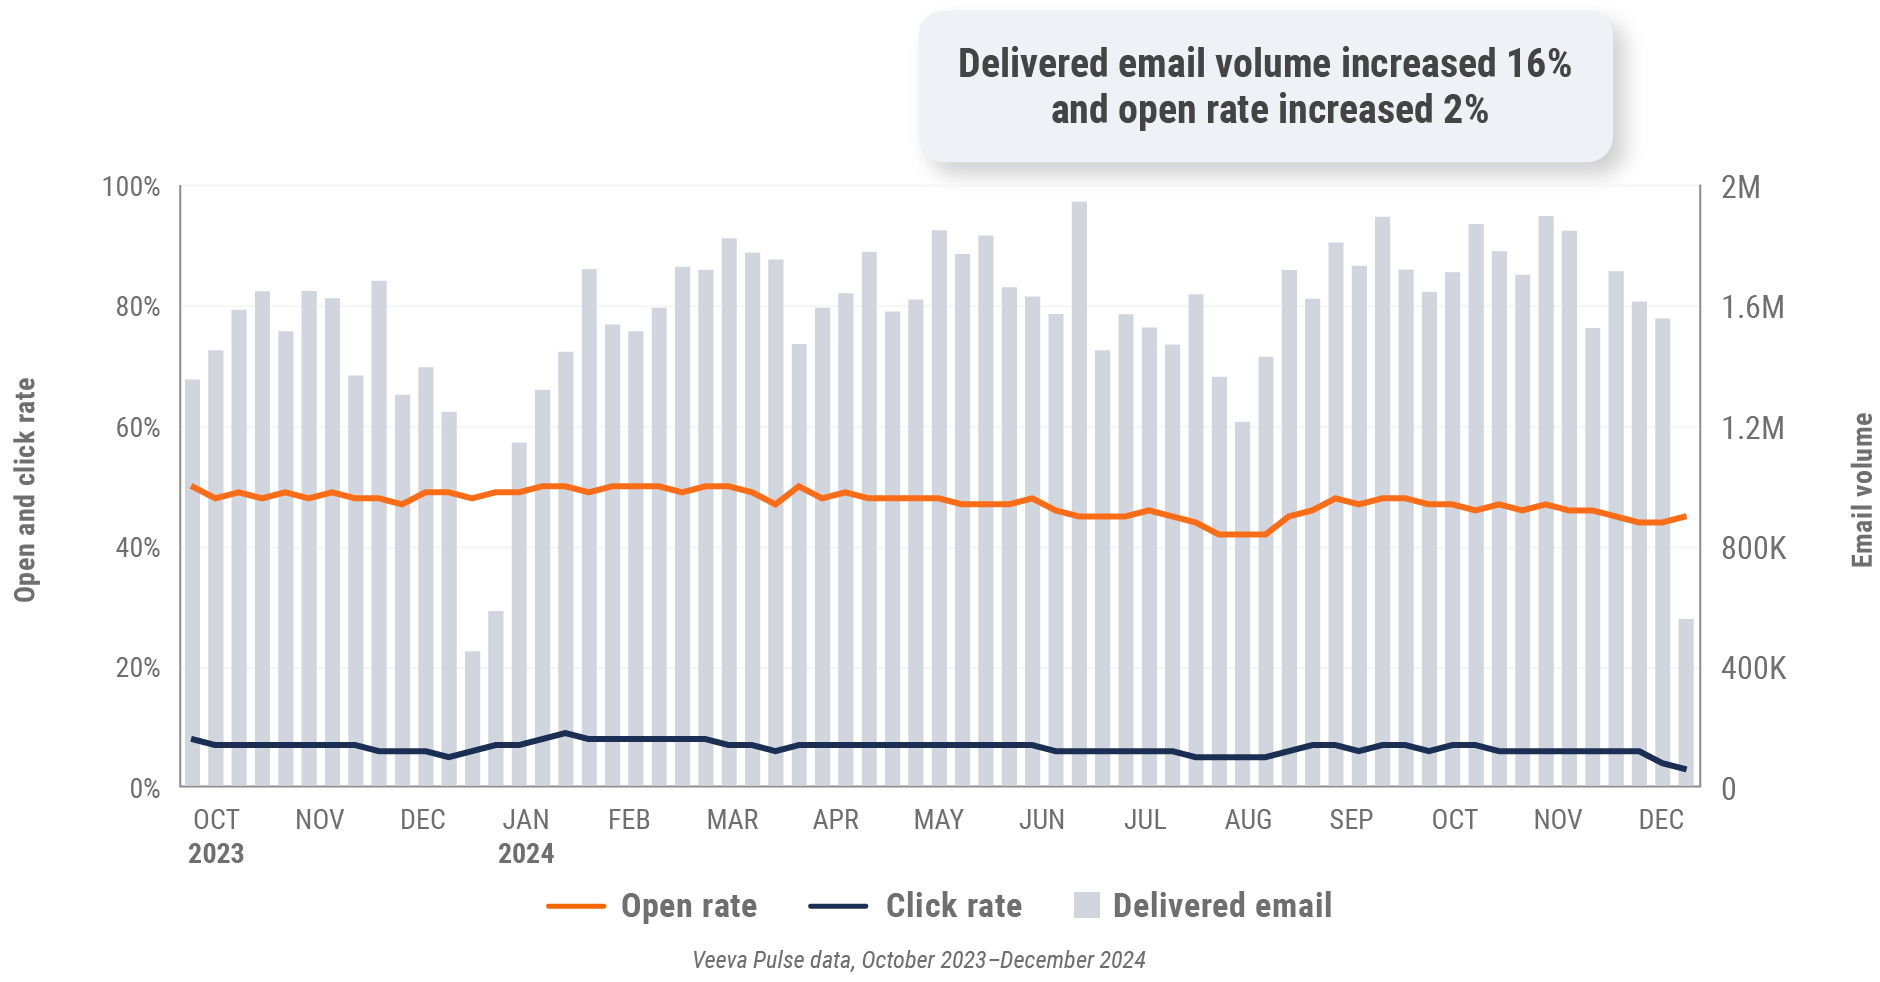
Figure 6: Content usage by channel, global
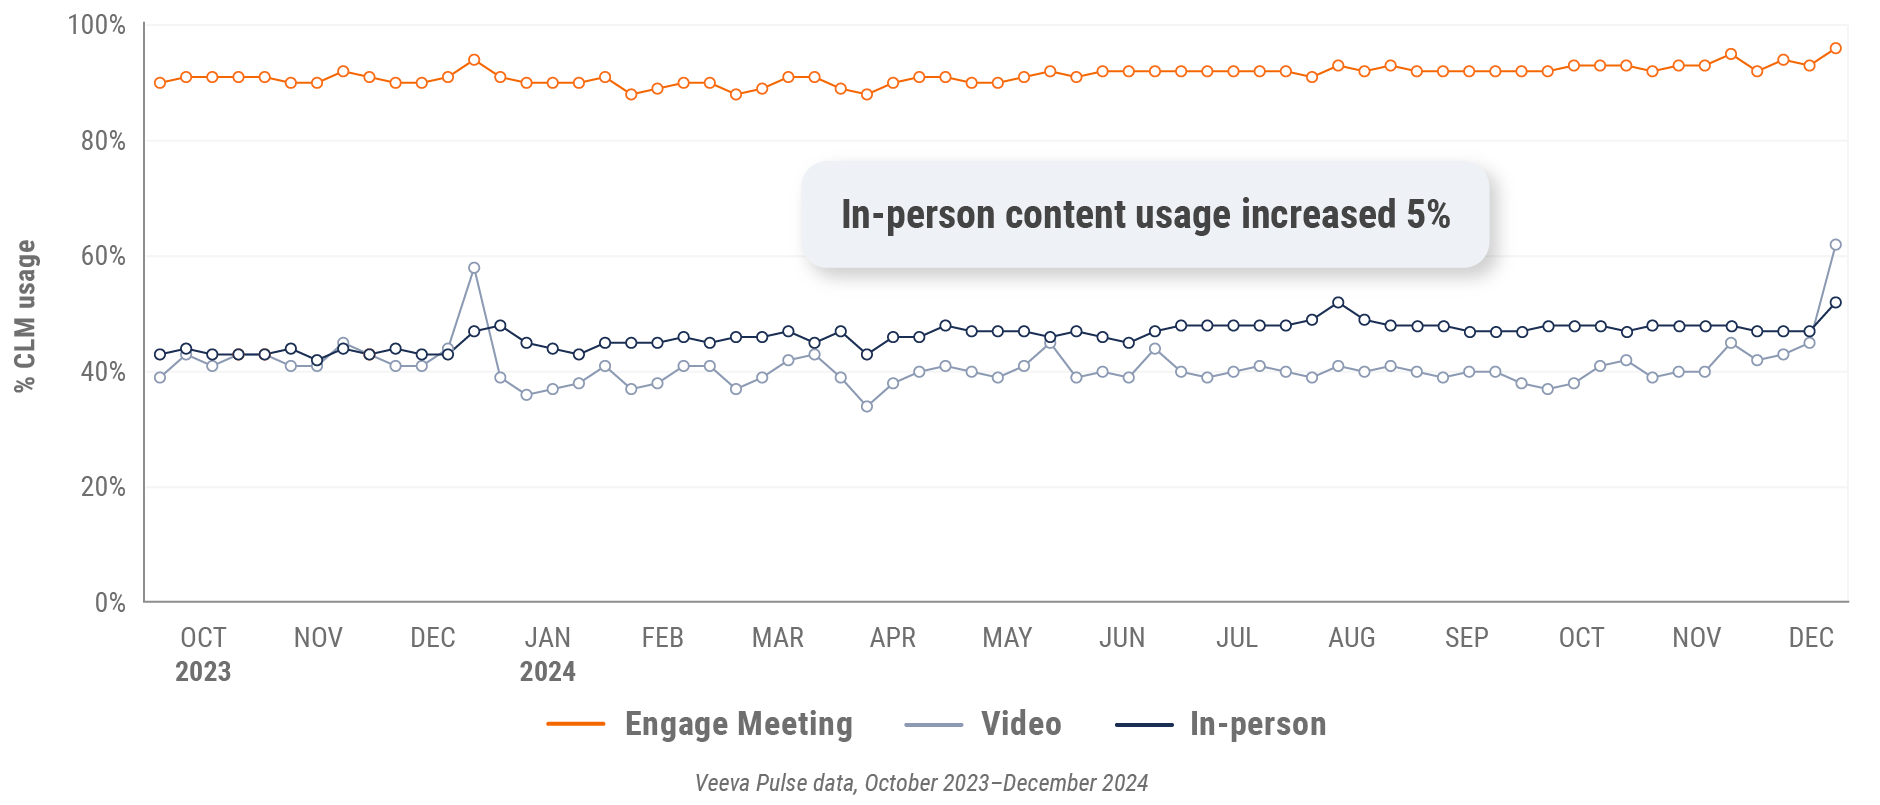
Figure 7: Veeva CRM Engage meeting duration, global

*This quarter’s global trends report omits data from China.
U.S. market trends
Figure 8: Channel mix evolution, U.S.
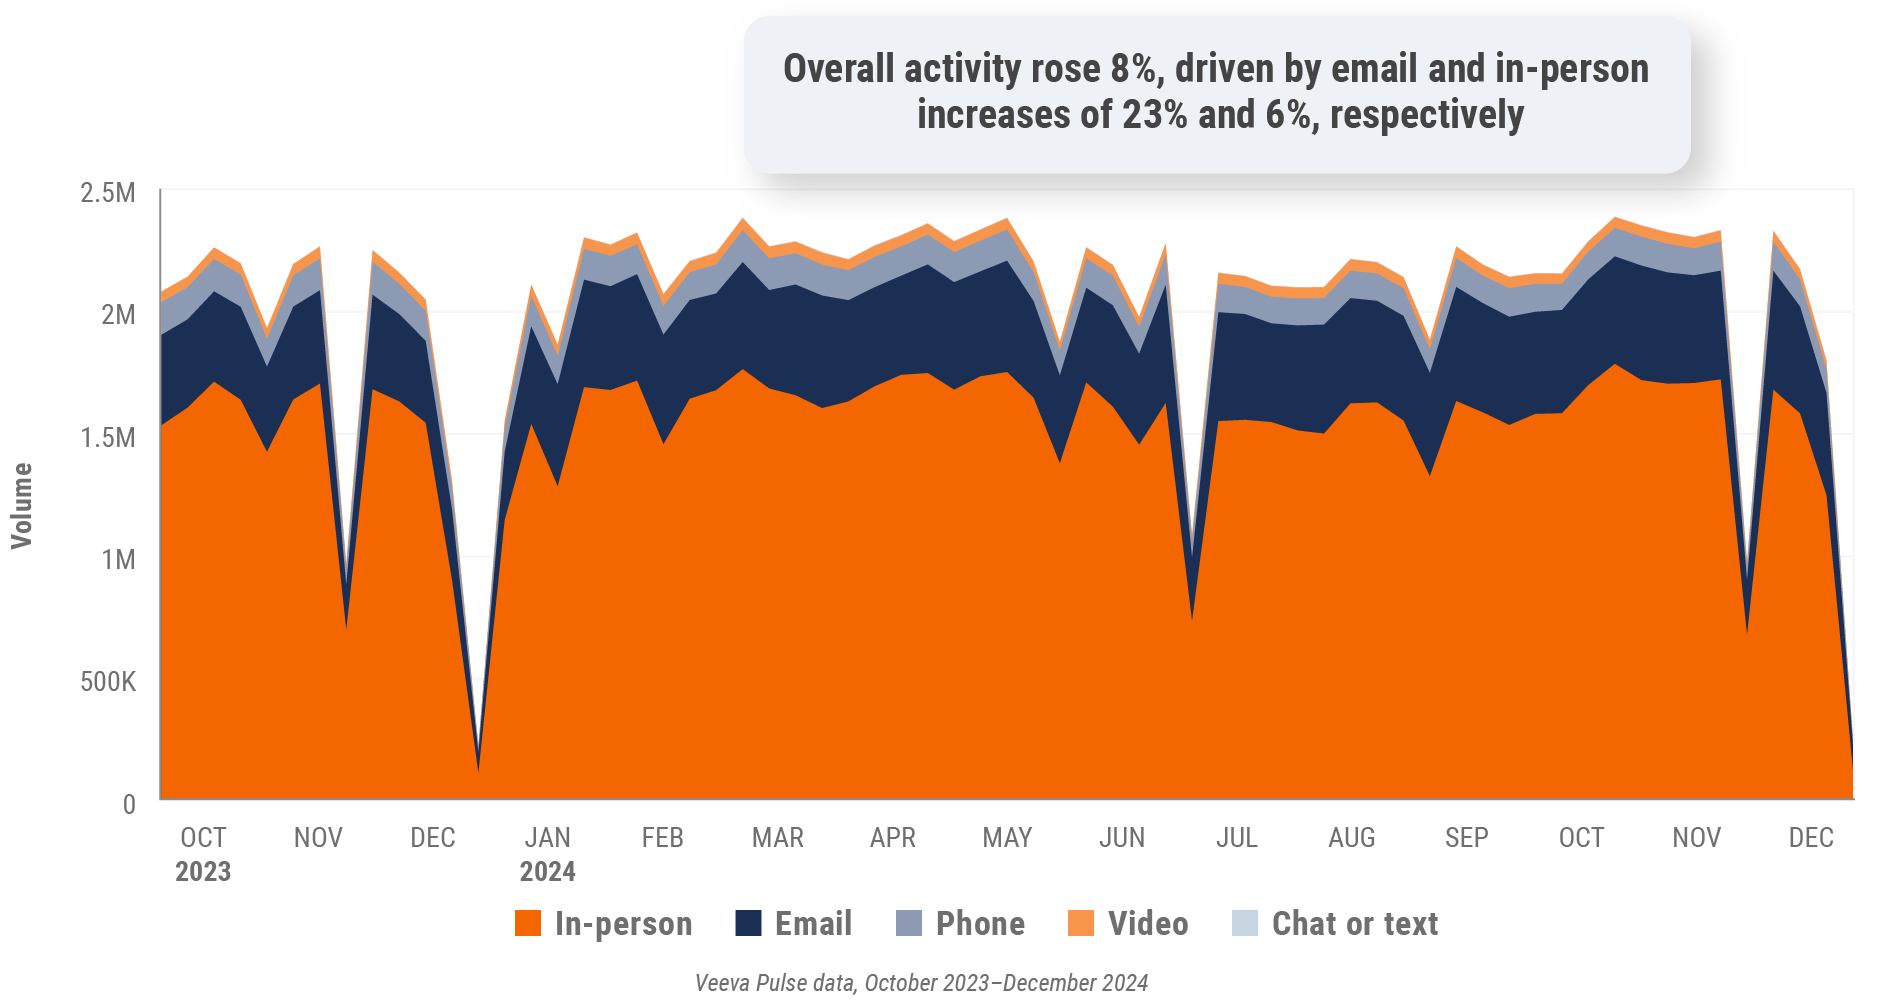
Figure 9: Channel mix, U.S.
U.S. field team activity
Weekly activity per user by engagement channel
Figure 10: Activity, U.S.
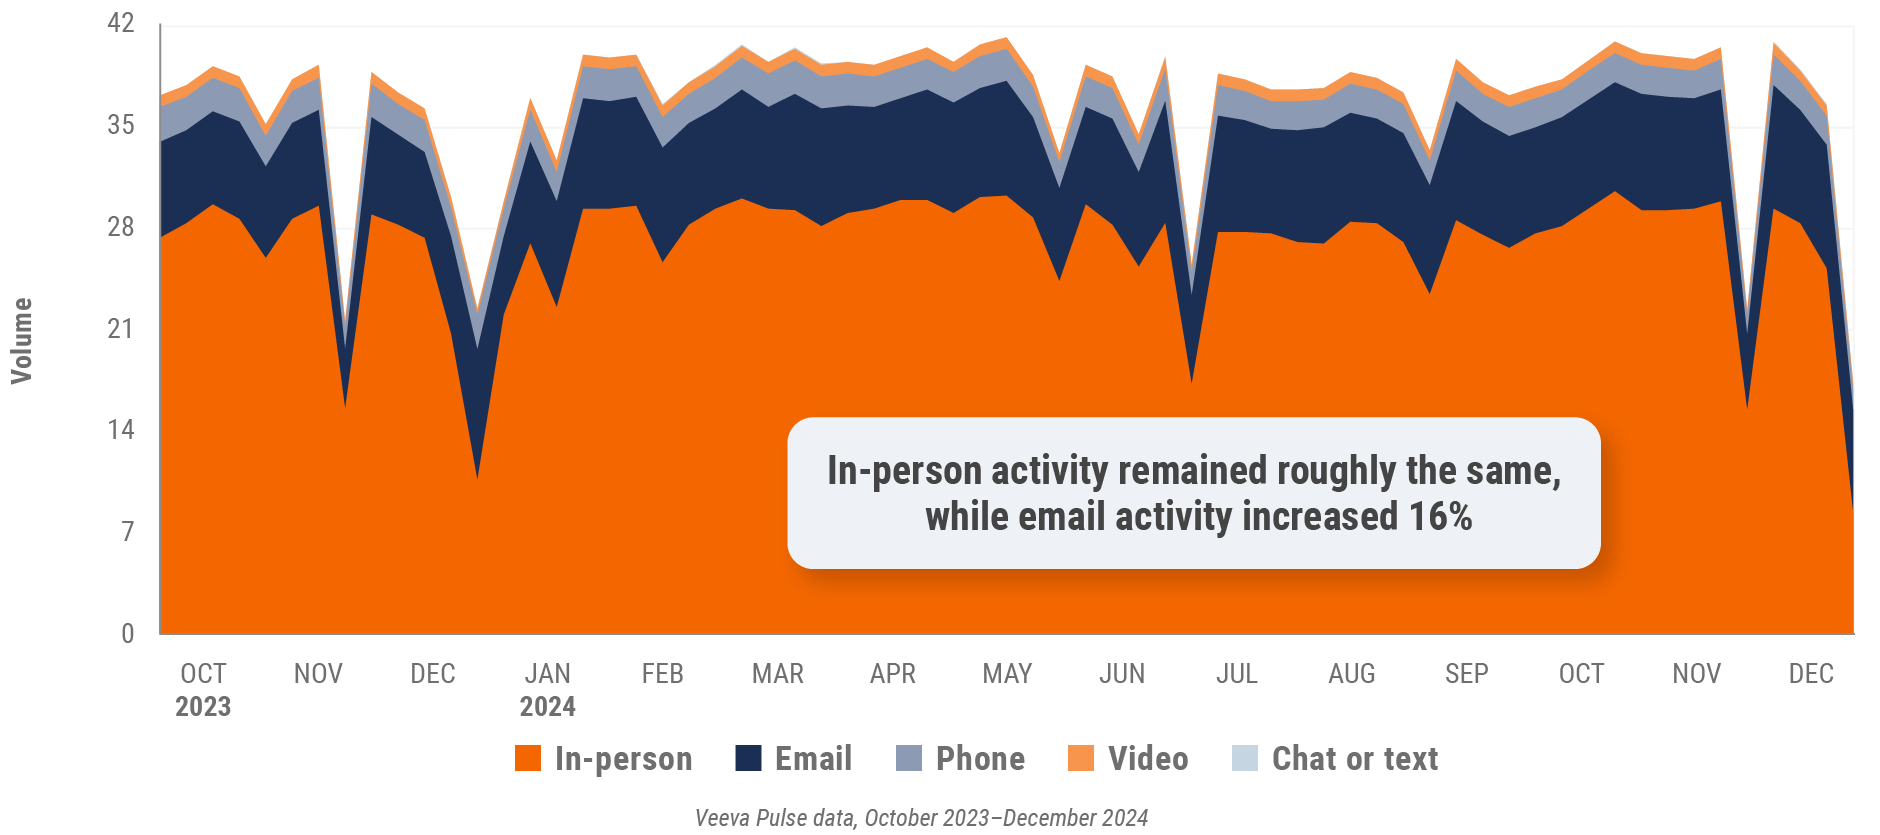
Figure 11: Activity by user type, U.S.
U.S. engagement quality
Consolidation of key quality metrics
Figure 12: Approved email volume, U.S.
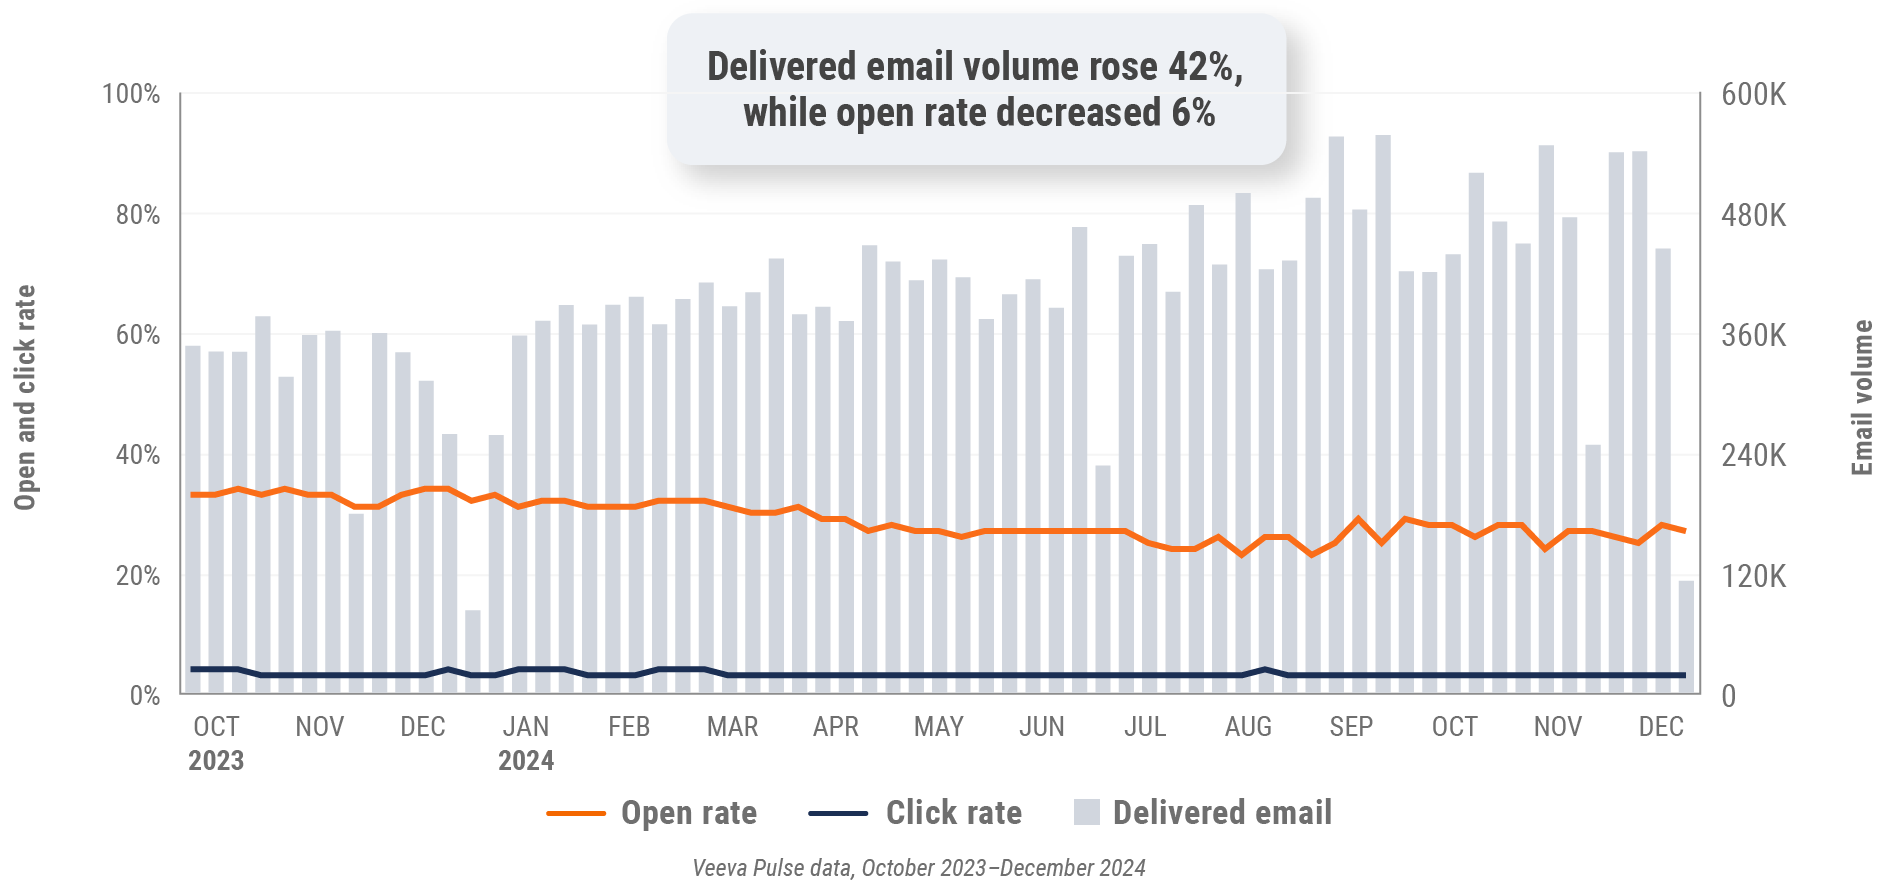
Figure 13: Content usage by channel, U.S.
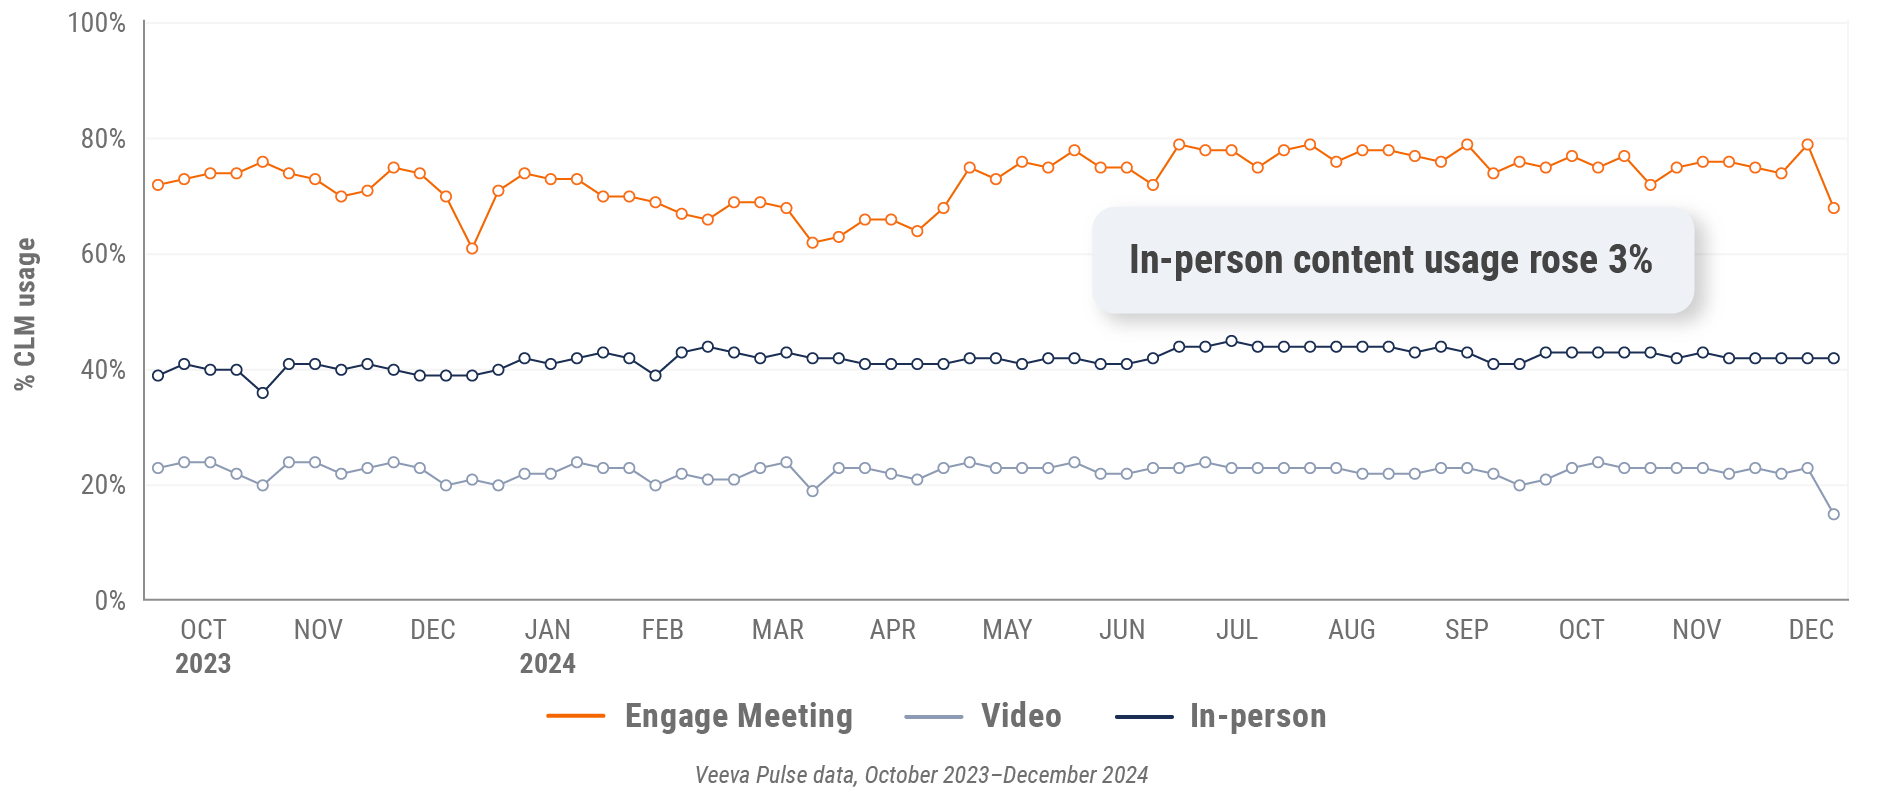
Figure 14: Veeva CRM Engage meeting duration, U.S.

Europe market trends
Figure 15: Channel mix evolution, Europe
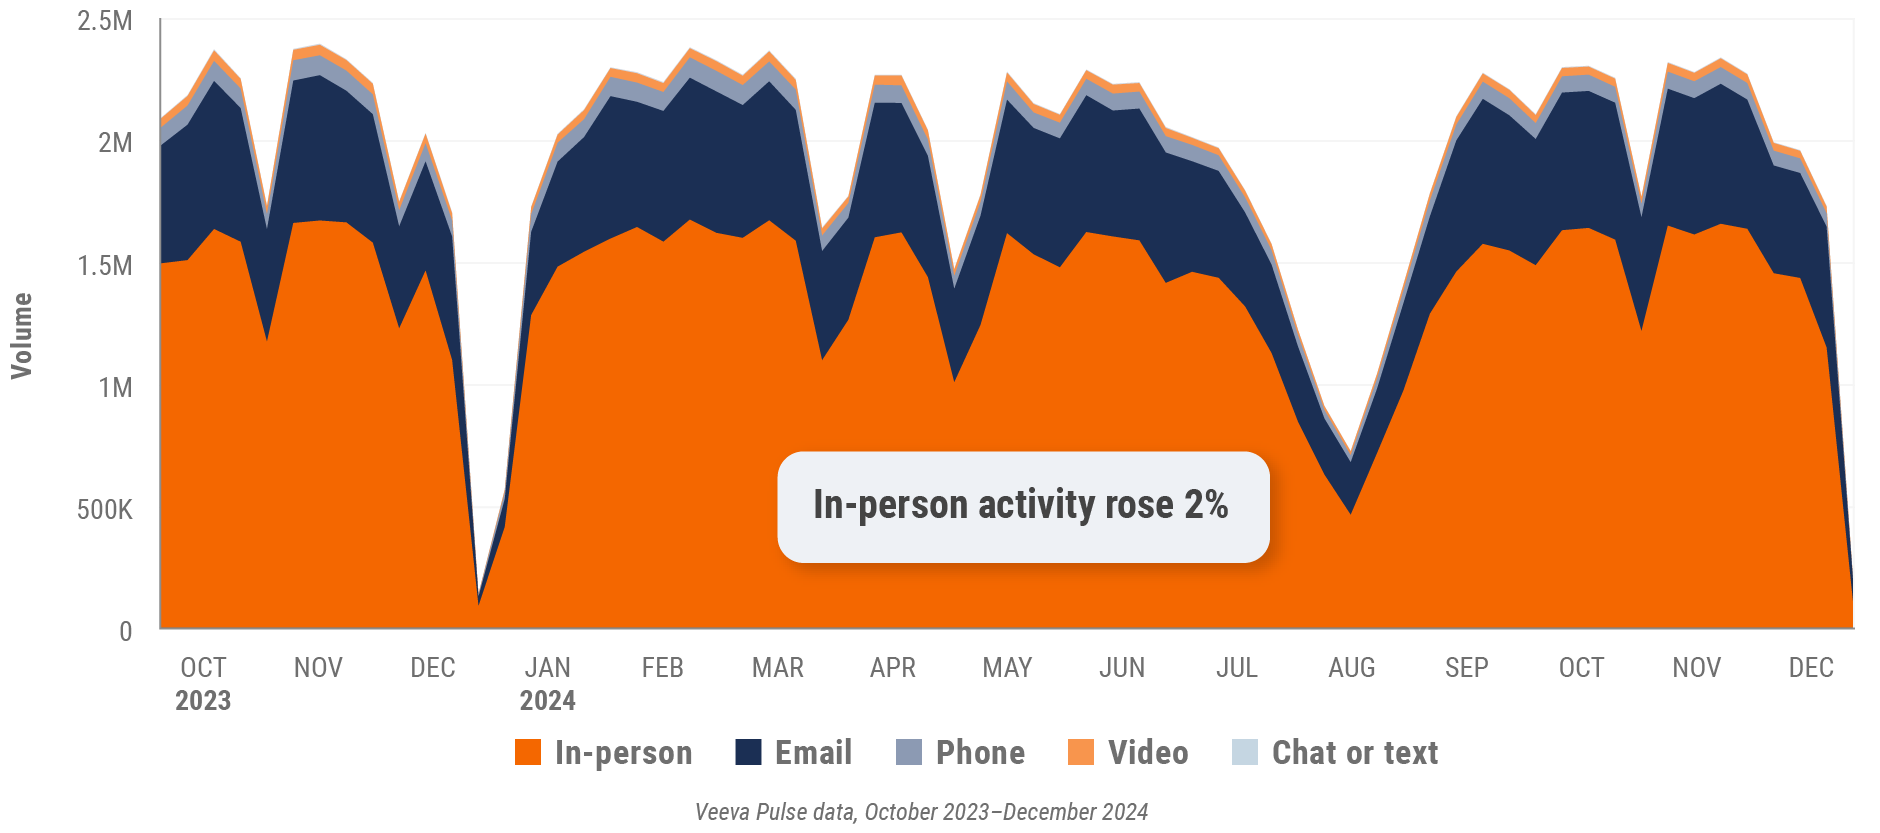
Figure 16: Channel mix, Europe
Europe field team activity
Weekly activity per user by engagement channel
Figure 17: Activity by country, EU5
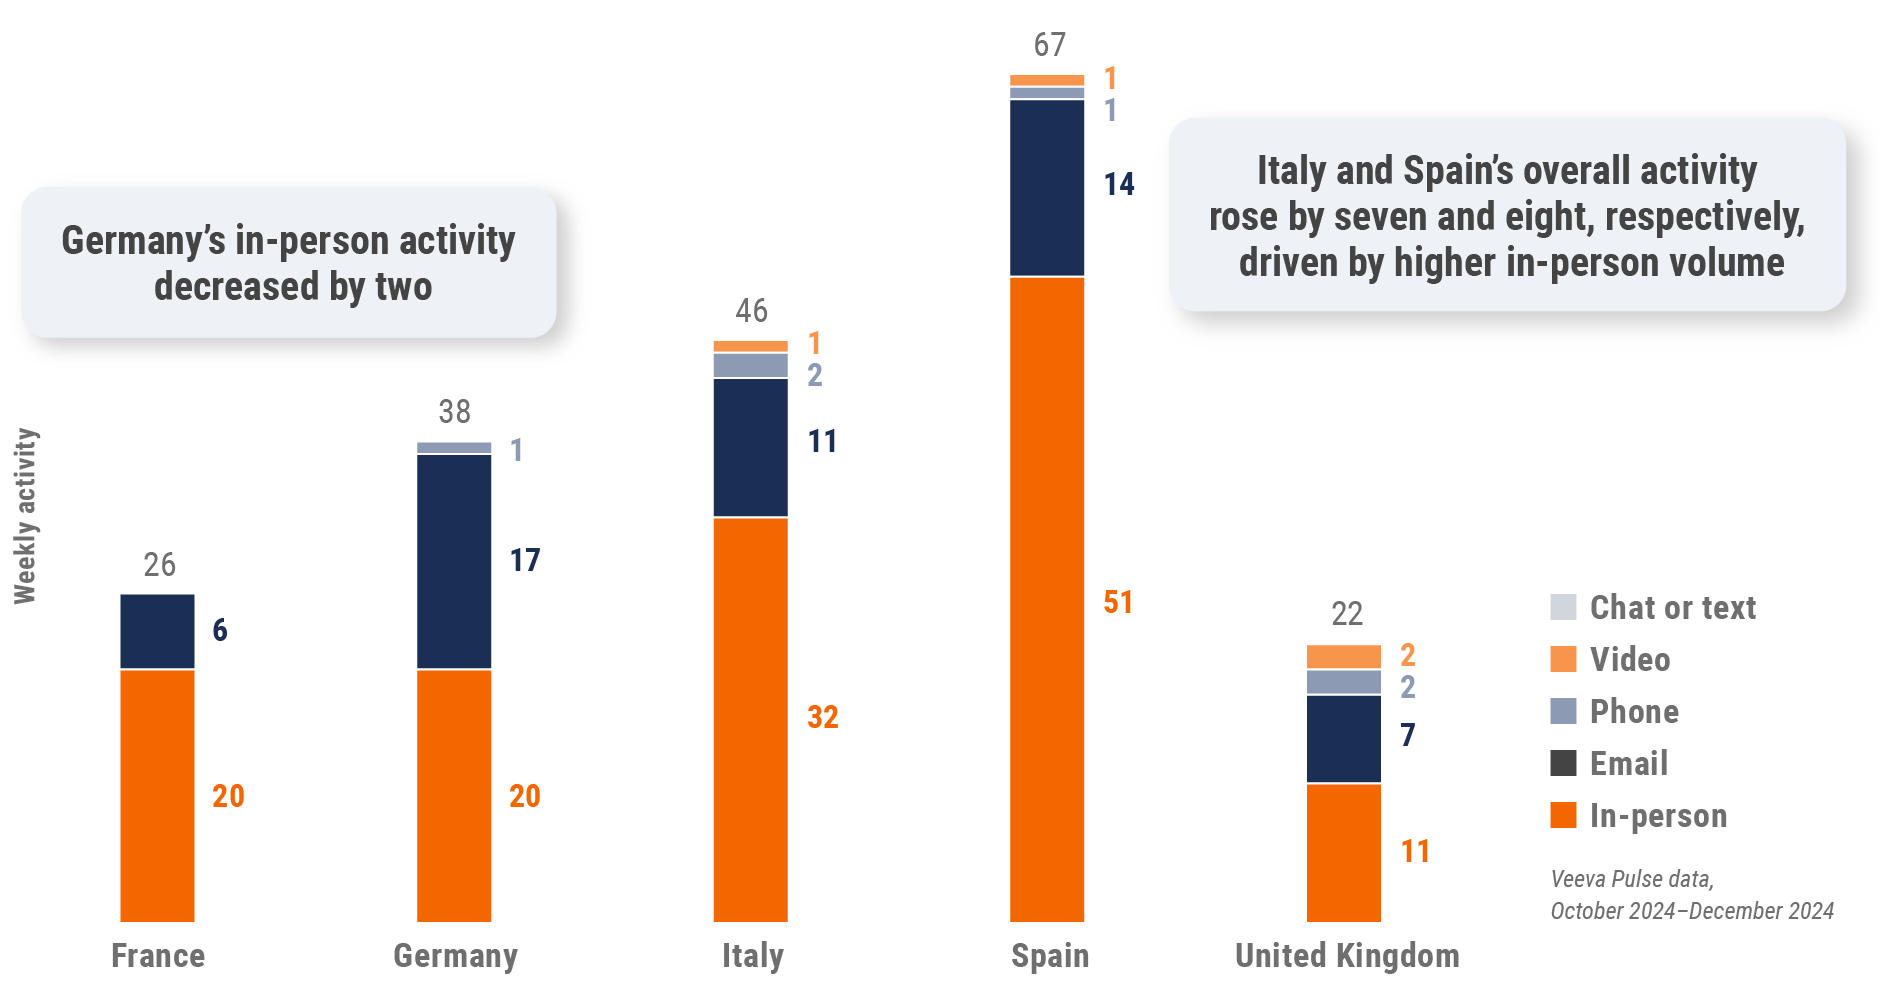
Figure 18: Activity by user type, Europe
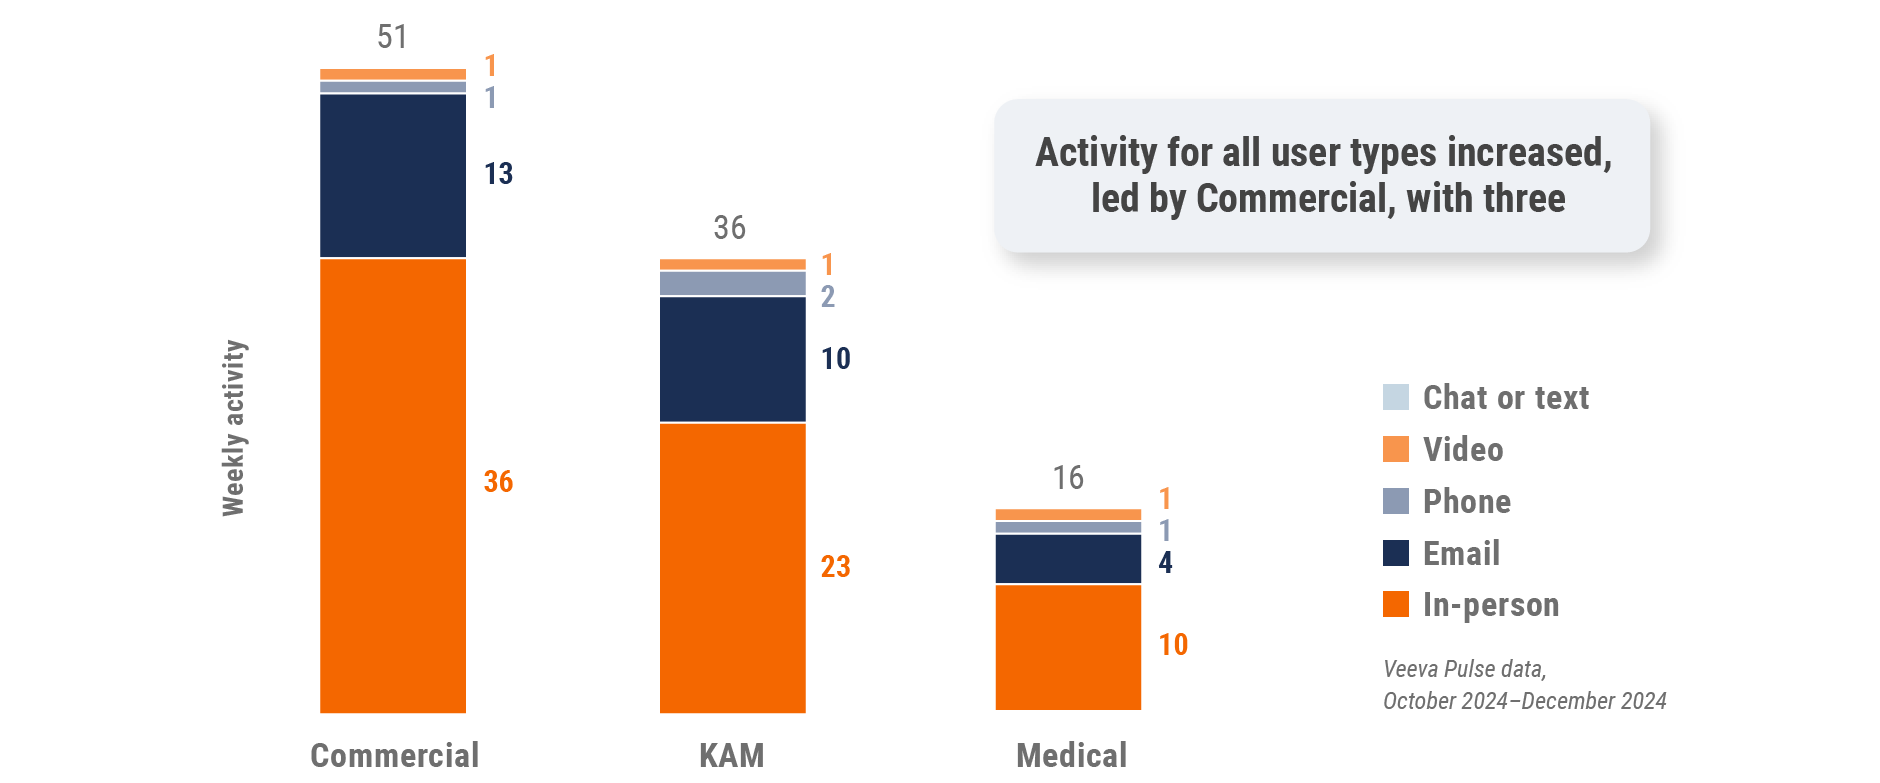
Europe engagement quality
Consolidation of key quality metrics
Figure 19: Approved email volume, Europe
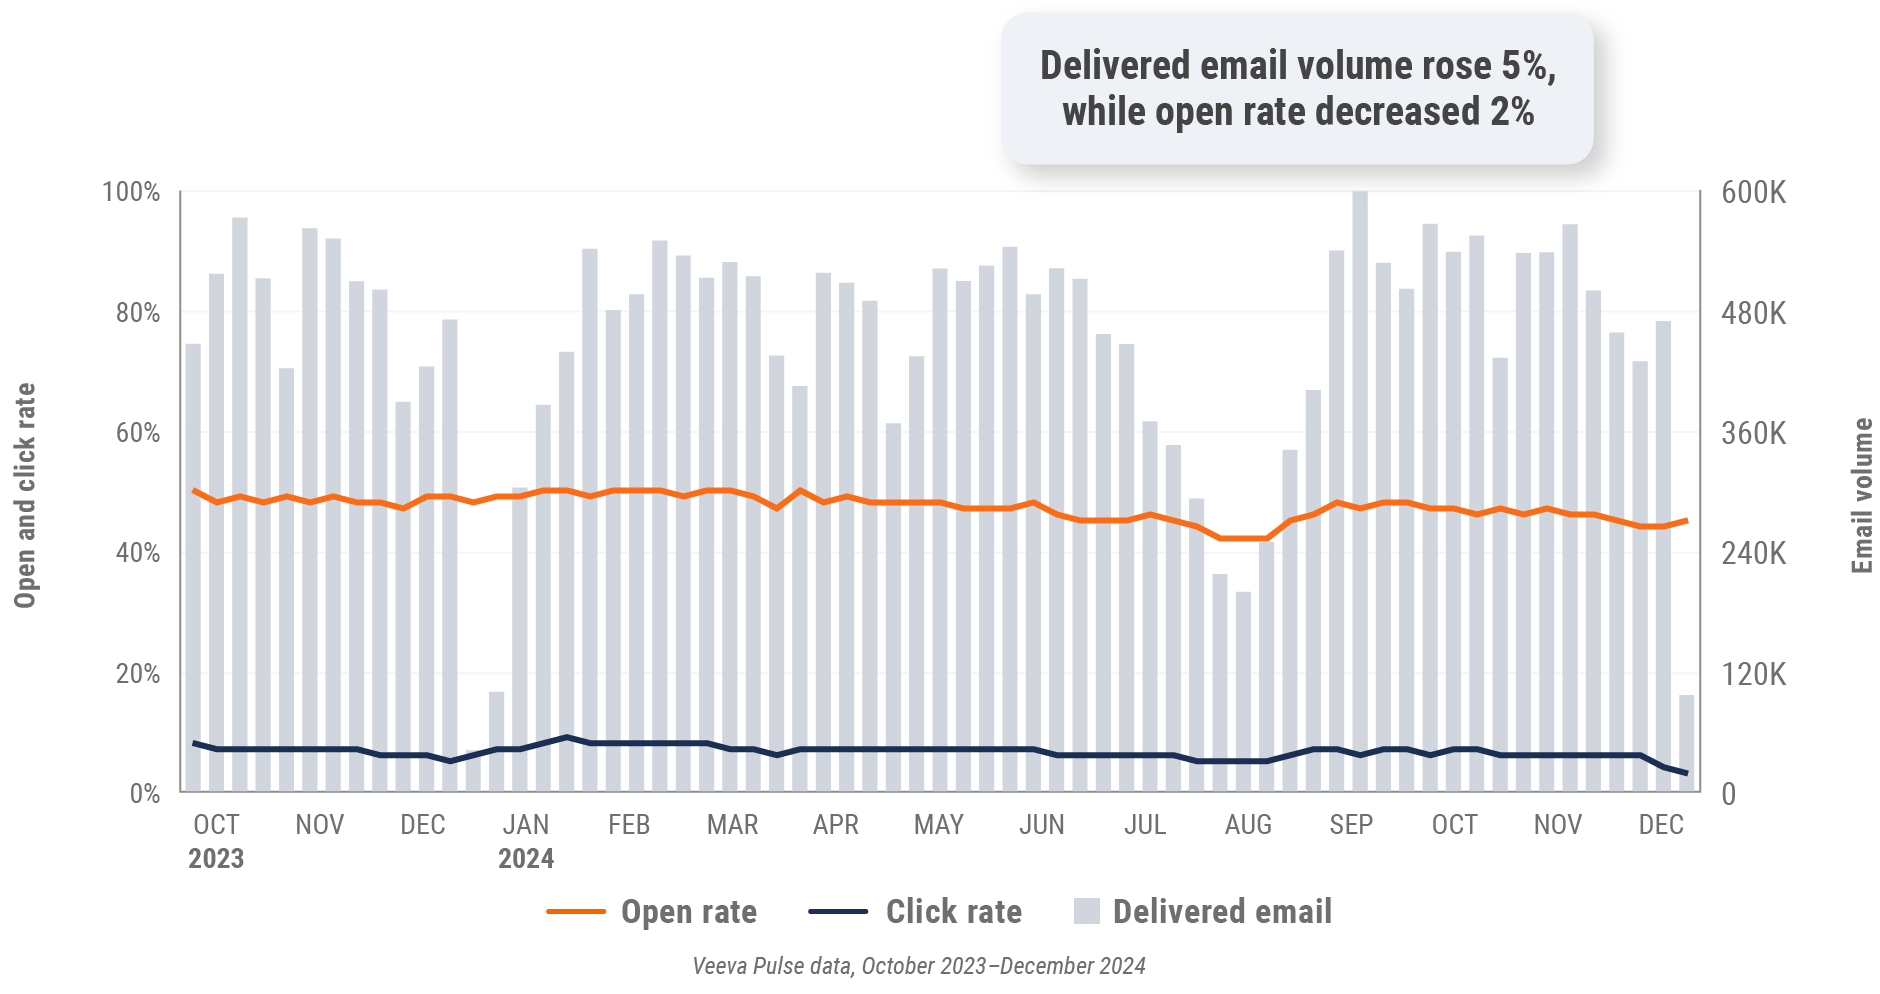
Figure 20: Content usage by channel, Europe
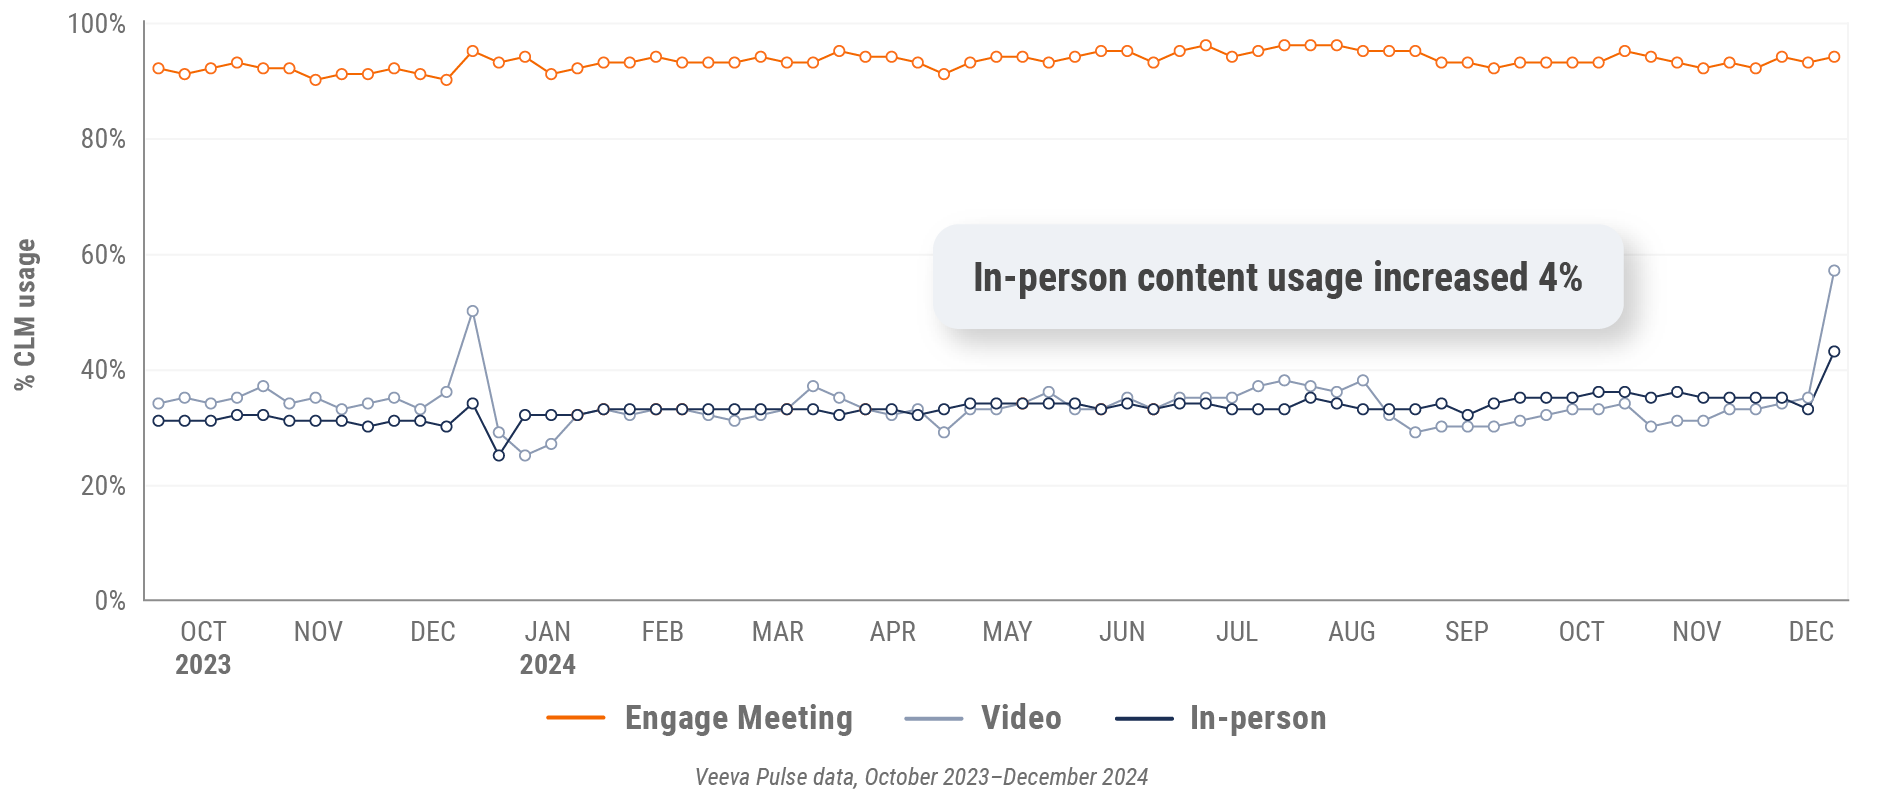
Figure 21: Veeva CRM Engage meeting duration, Europe

Asia market trends
Figure 22: Channel mix evolution, Asia
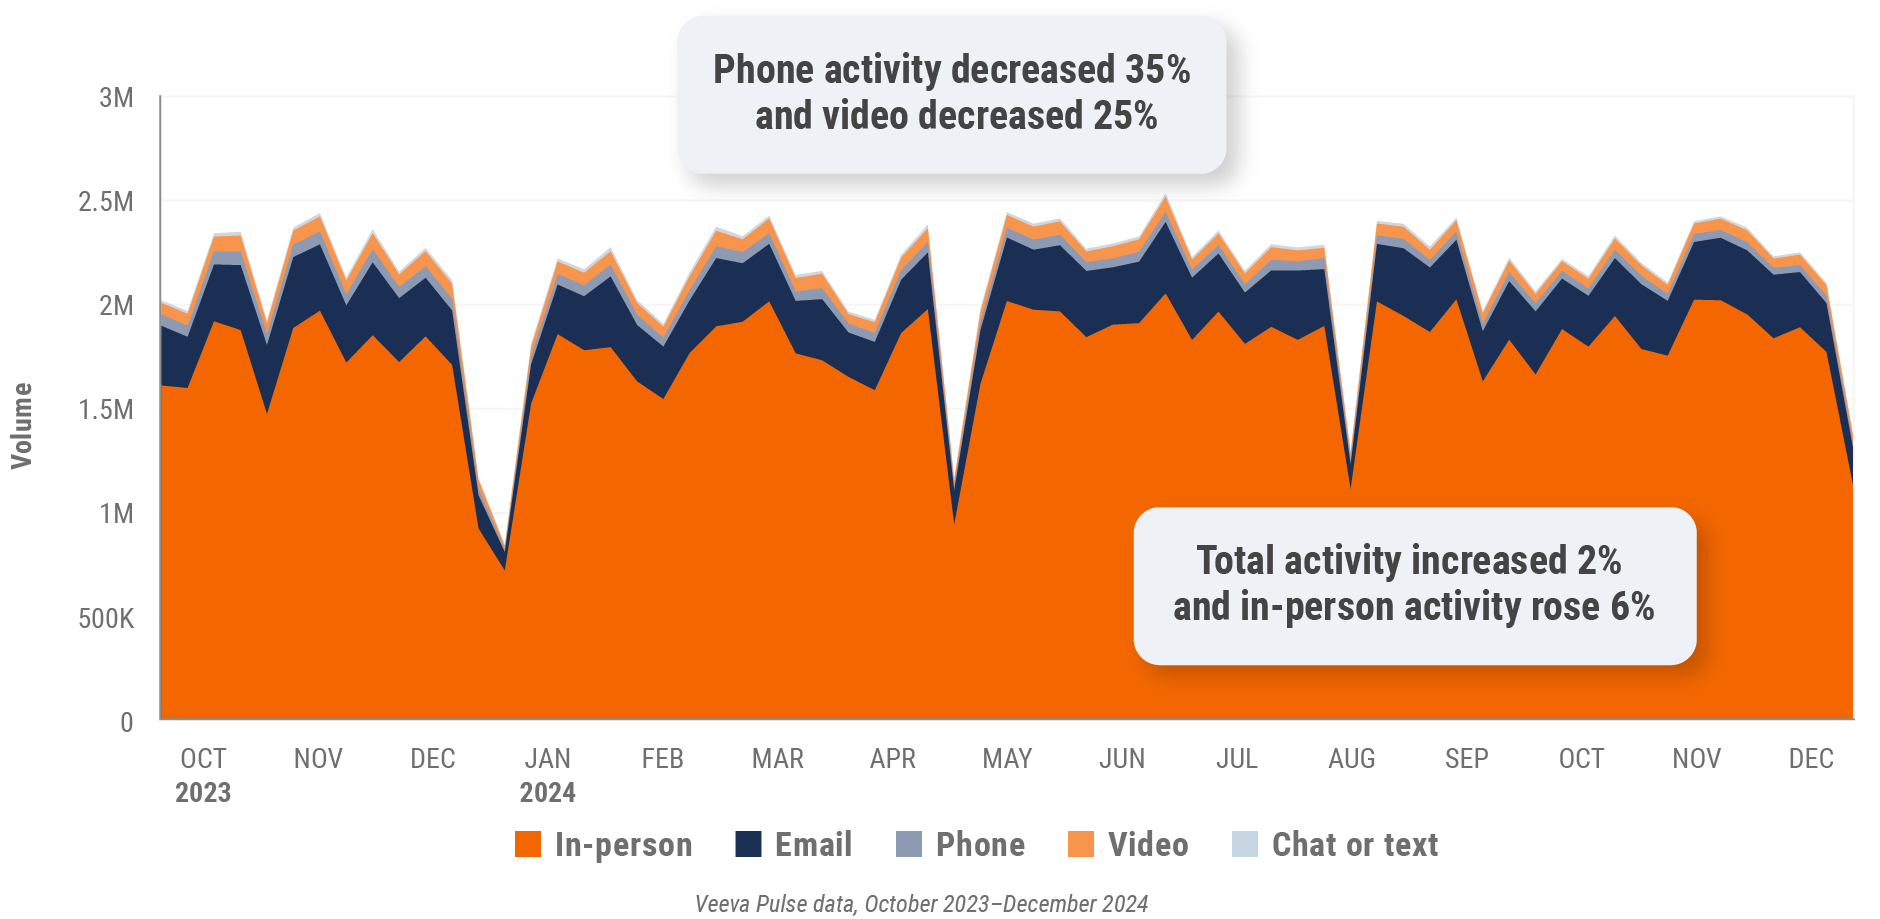
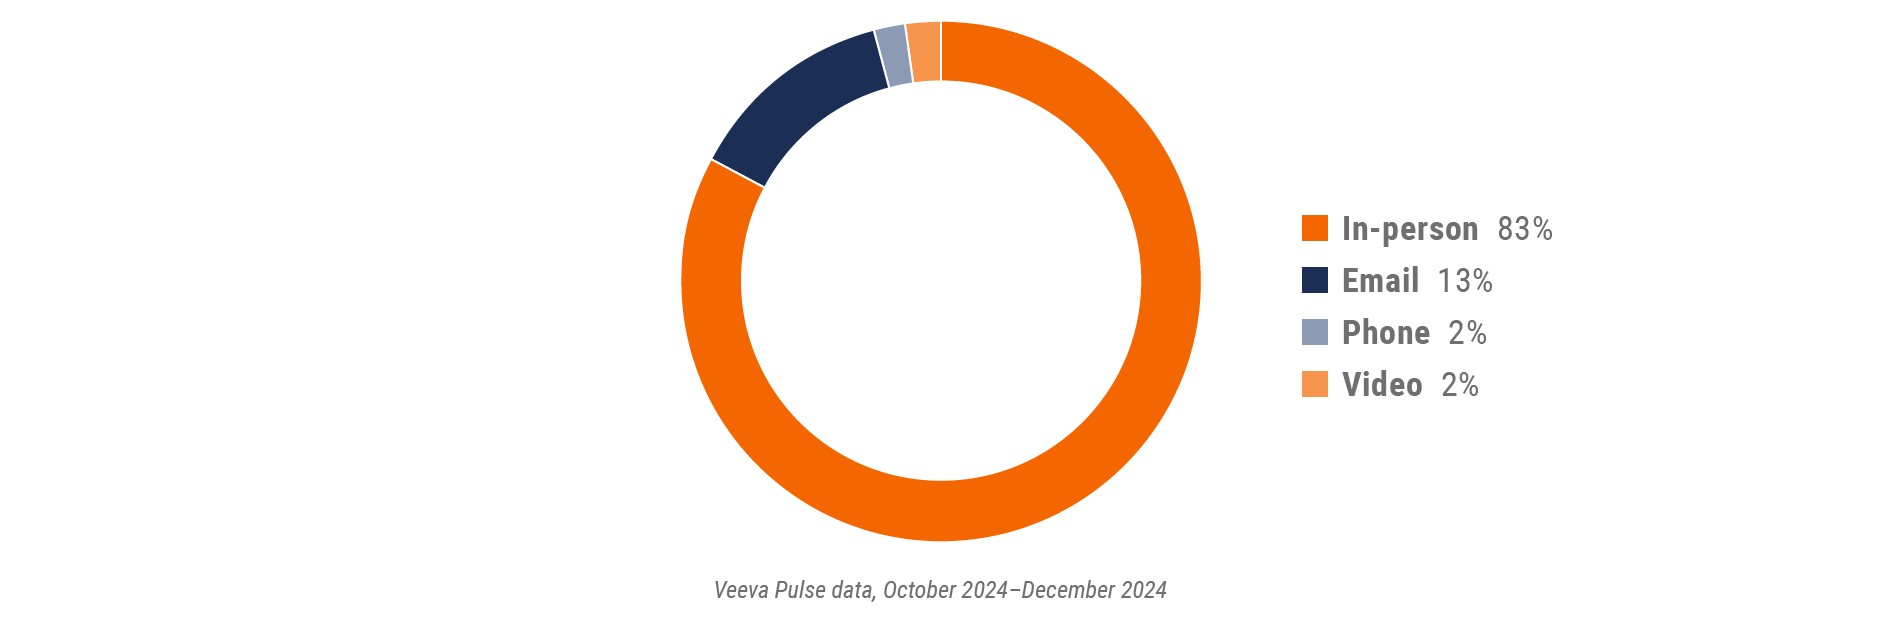
Figure 23: Channel mix, Asia
Asia field team activity
Weekly activity per user by engagement channel
Figure 24: Activity by country, Asia
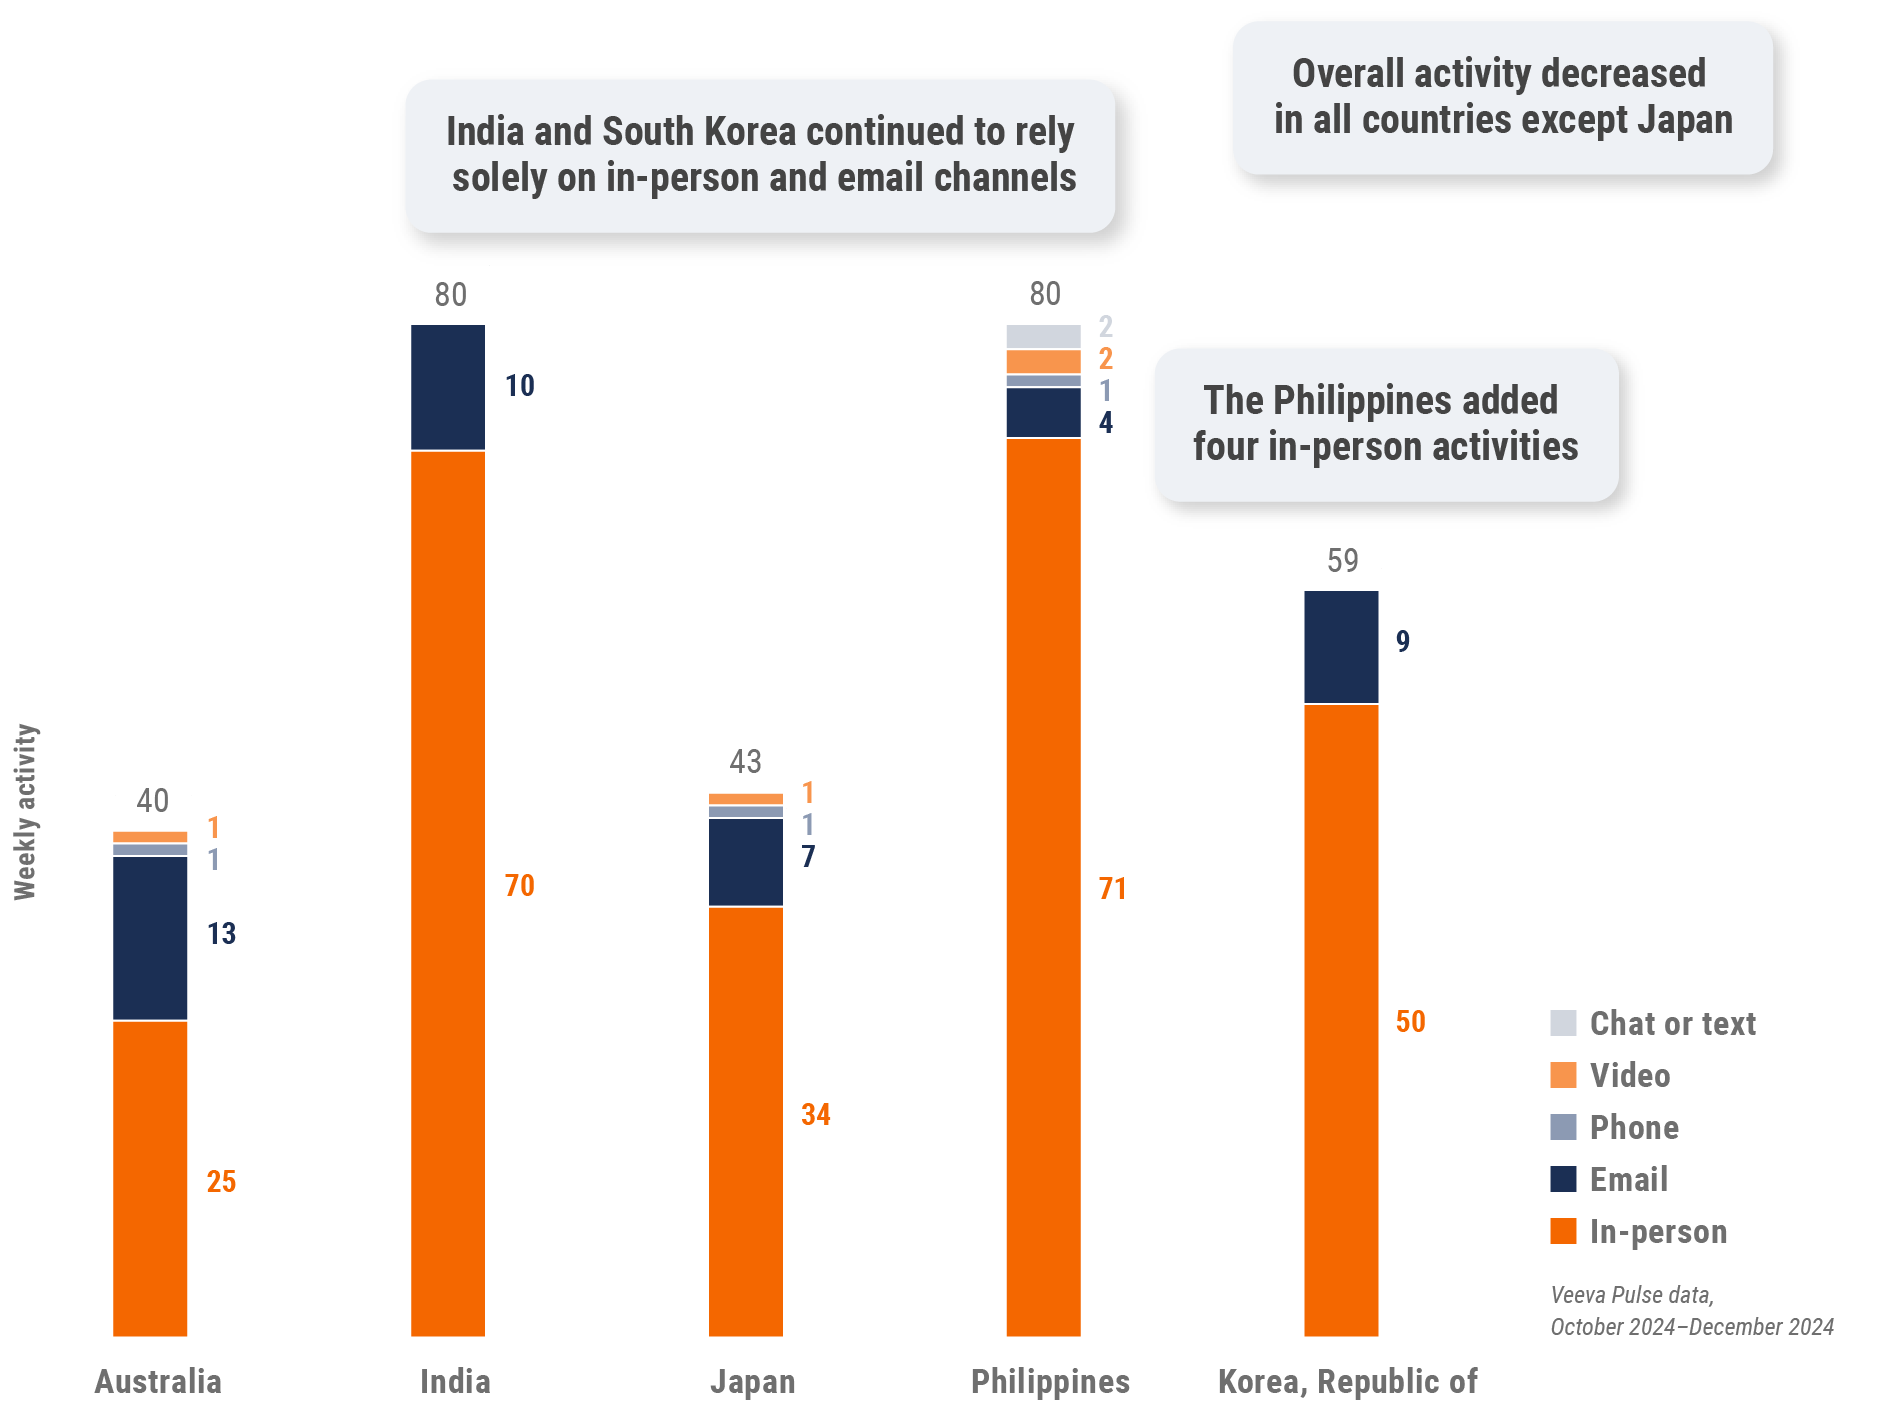
Figure 25: Activity by user type, Asia
Asia engagement quality
Consolidation of key quality metrics
Figure 26: Approved email volume, Asia
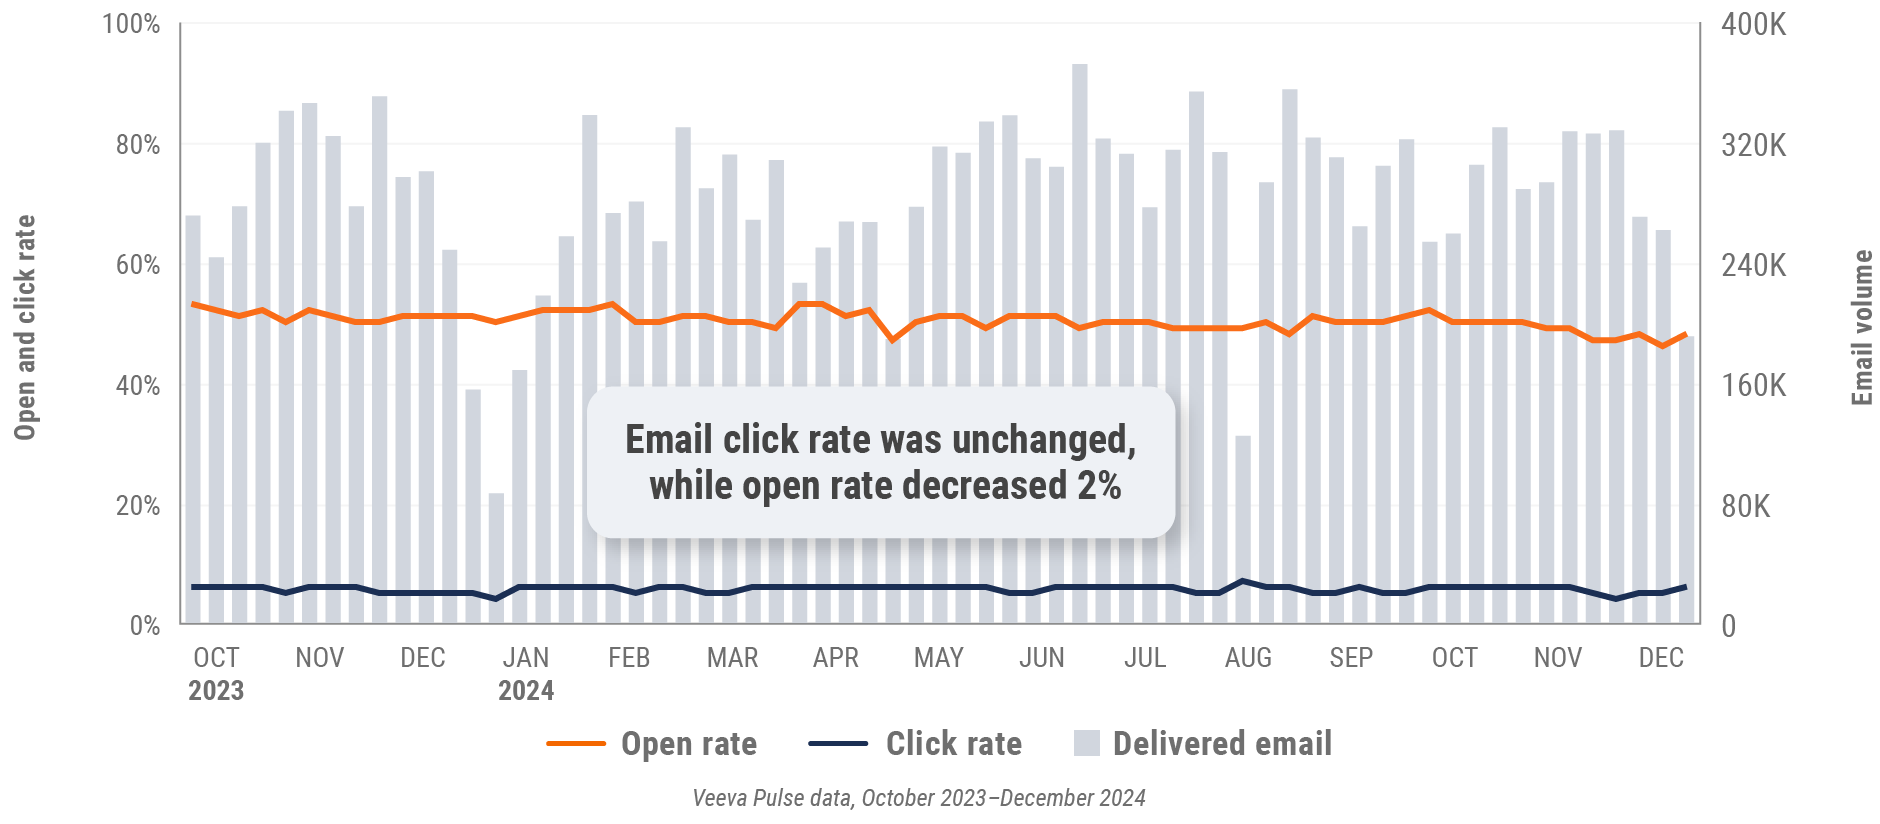
Figure 27: Content usage by channel, Asia
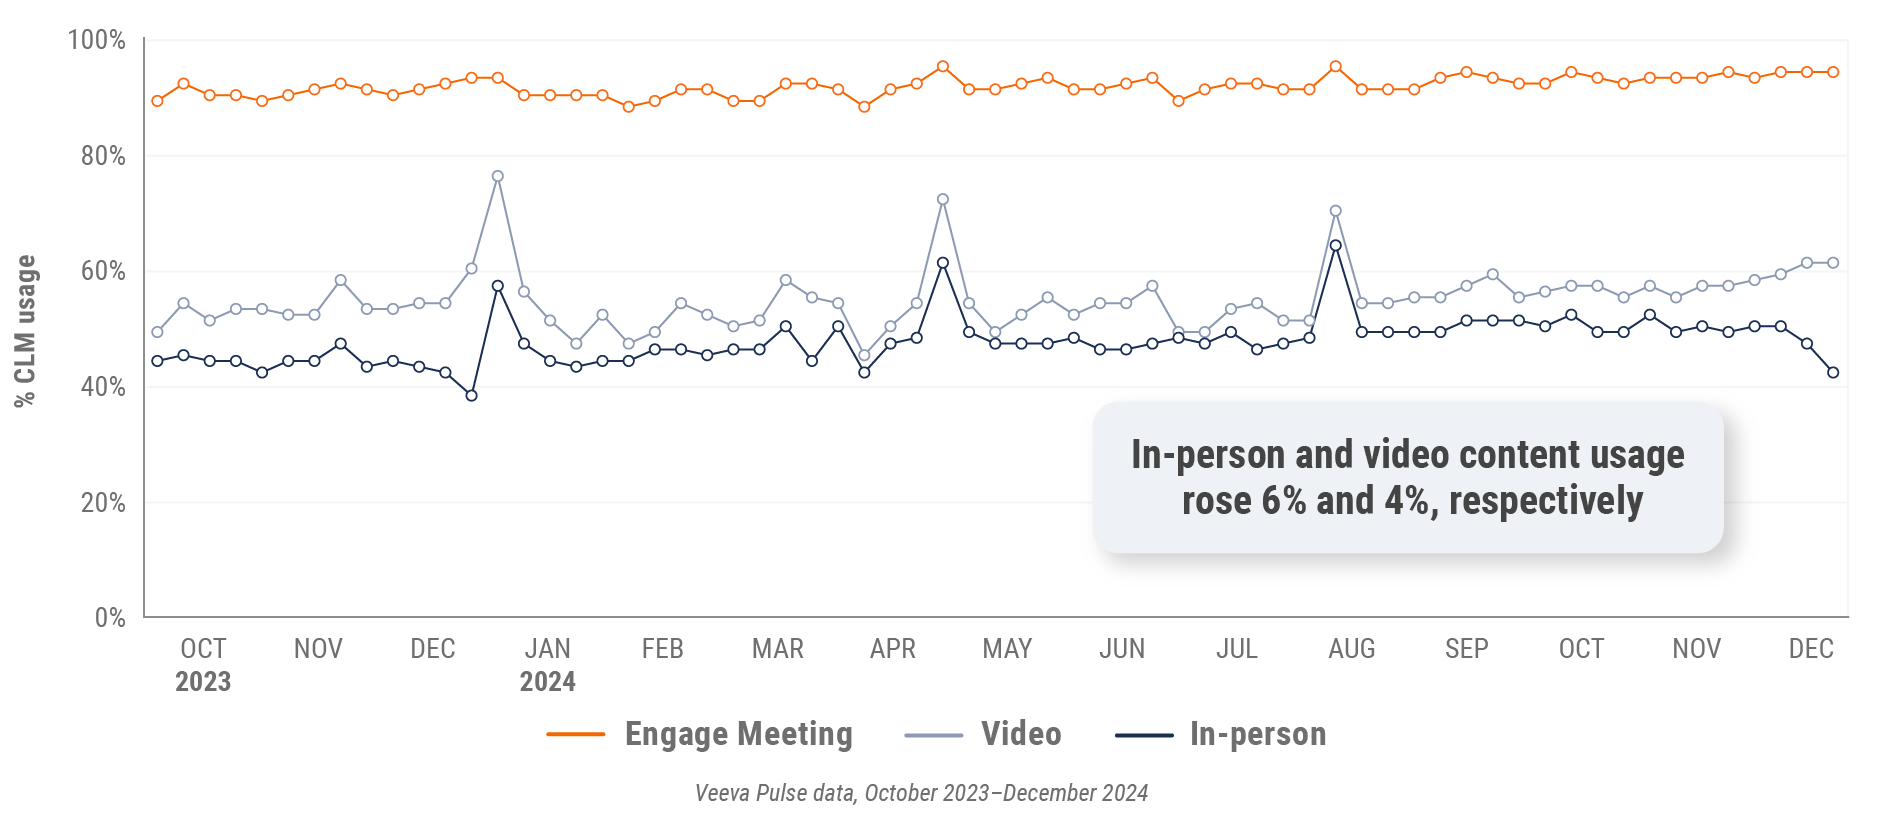
Figure 28: Veeva CRM Engage meeting duration, Asia

Latin America market trends
Figure 29: Channel mix evolution, Latin America
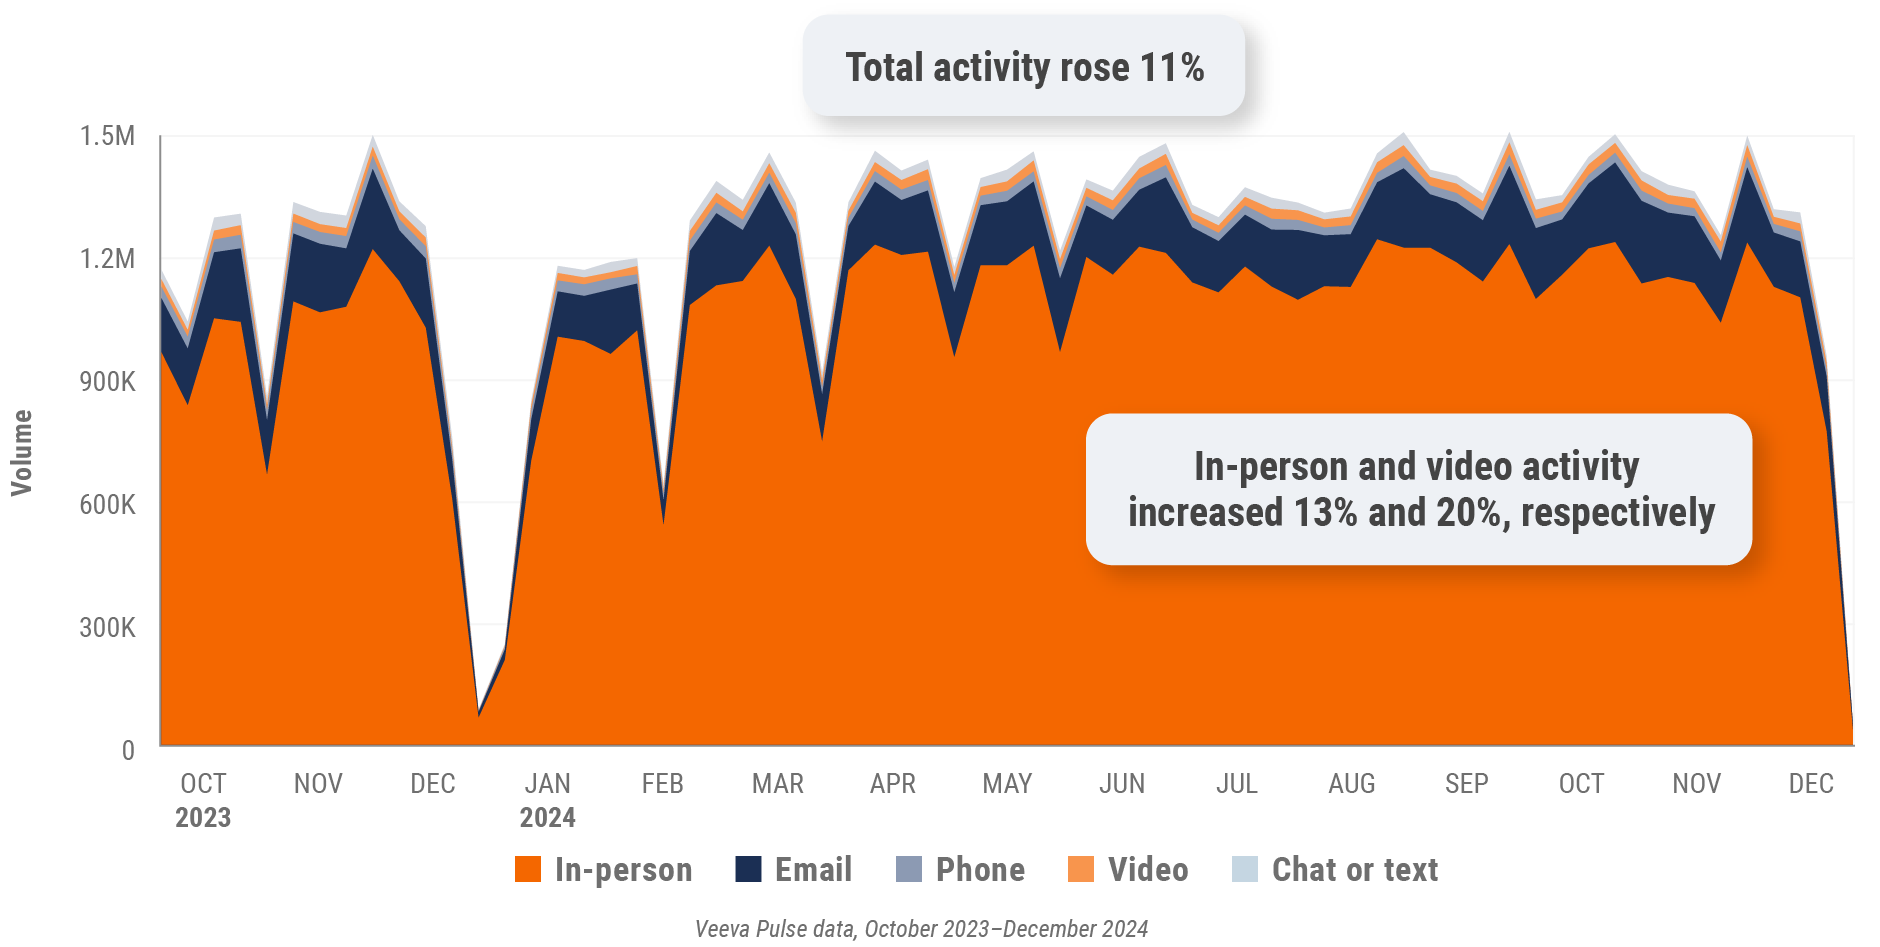
Figure 30: Channel mix, Latin America
Latin America field team activity
Weekly activity per user by engagement channel
Figure 31: Activity by country, Latin America
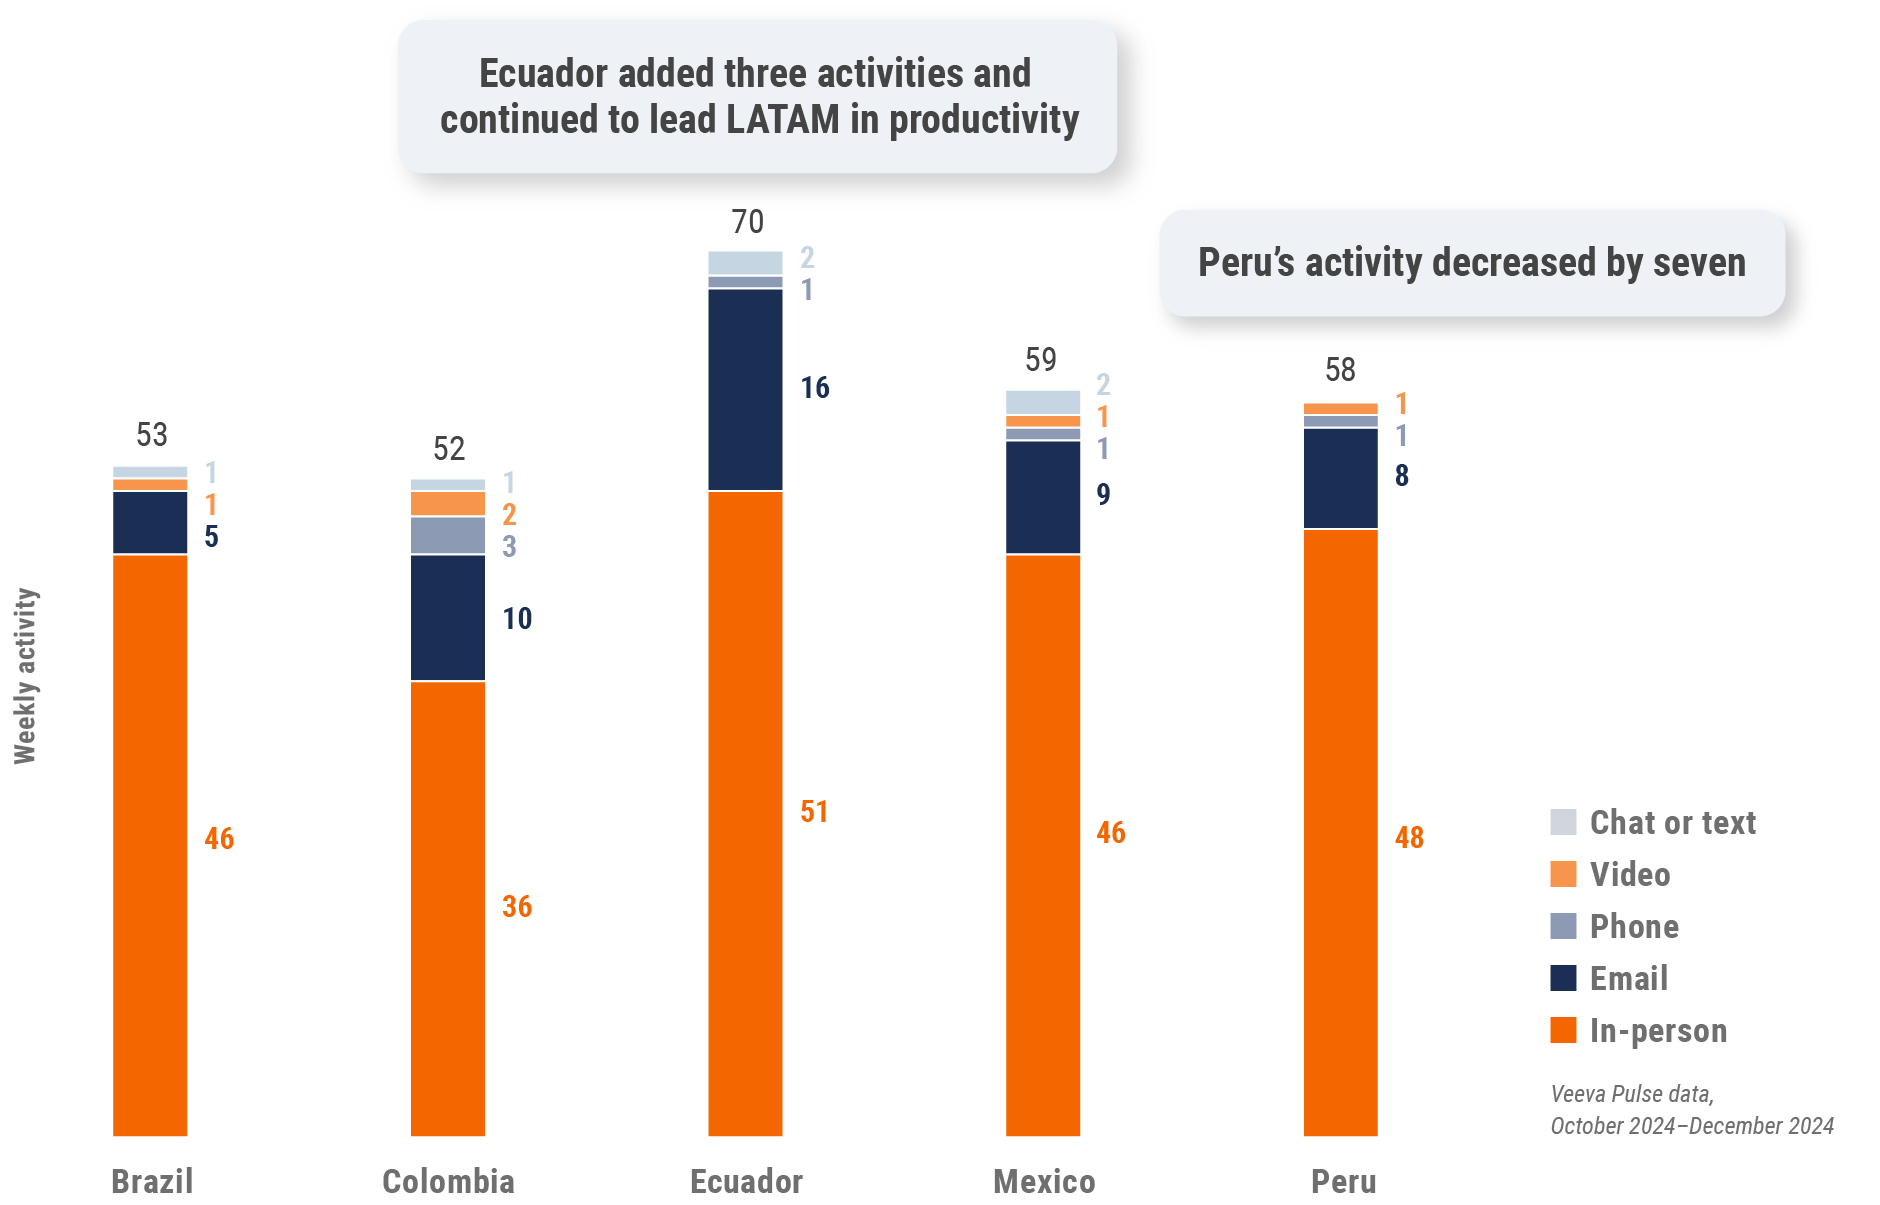
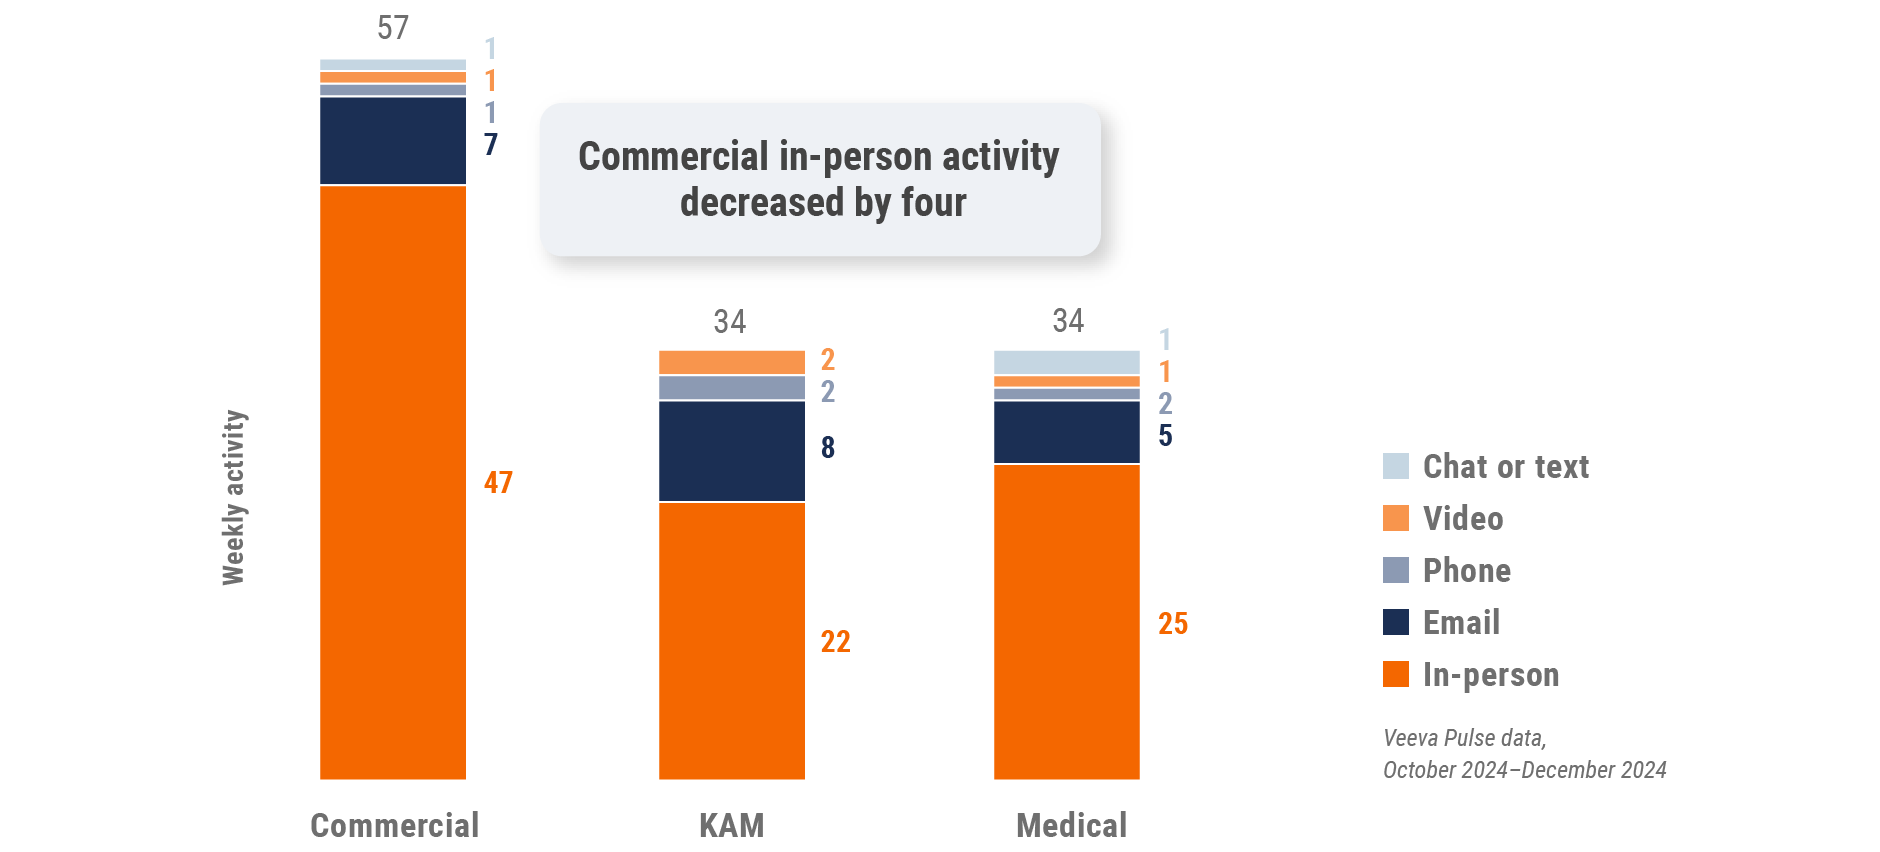
Figure 32: Activity by user type, Latin America
Latin America engagement quality
Consolidation of key quality metrics
Figure 33: Approved email volume, Latin America
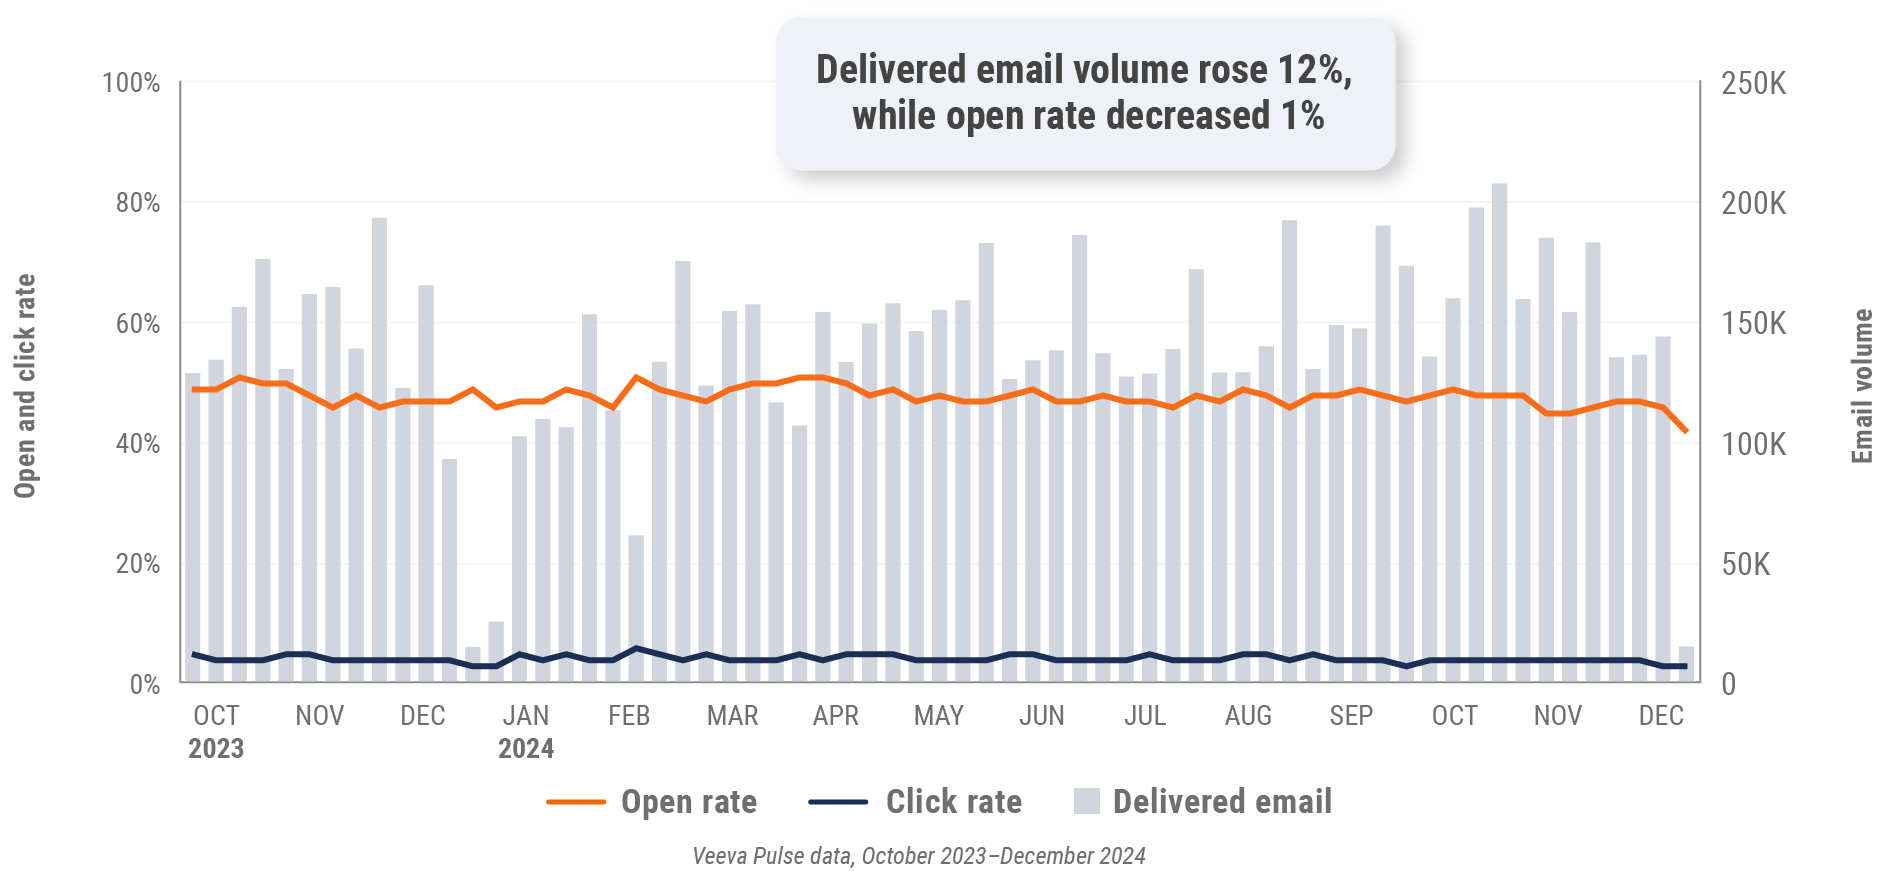
Figure 34: Content usage by channel, Latin America
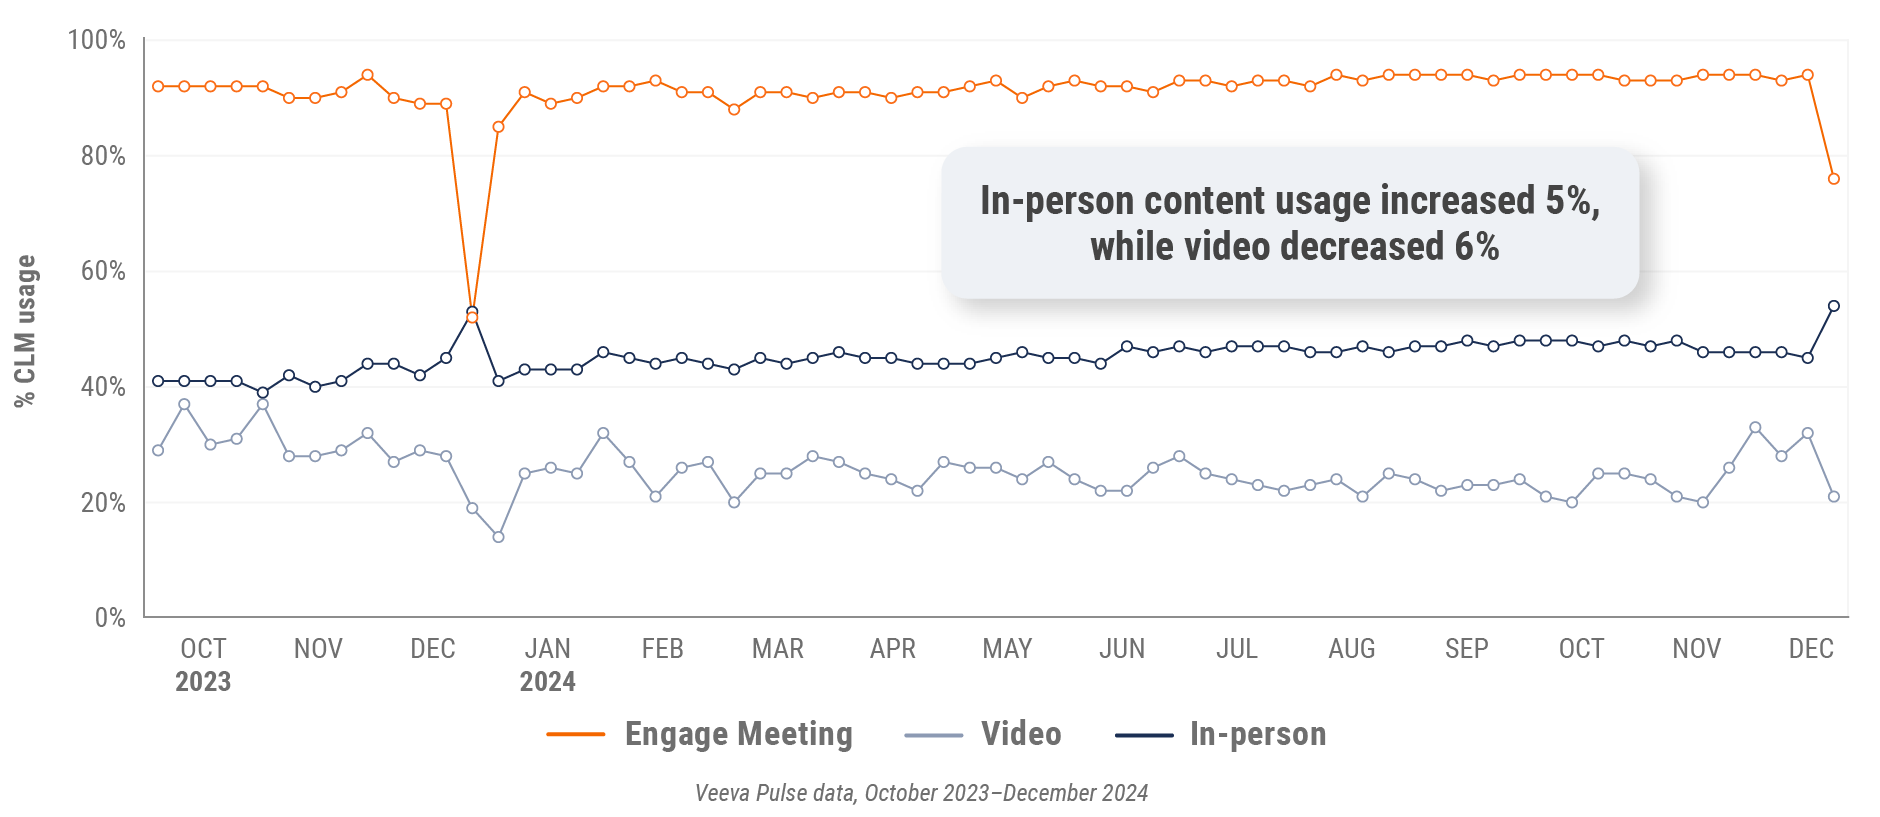
Figure 35: Veeva CRM Engage meeting duration, Latin America

Appendix: Data dictionary
Metric definitions
- Channel mix evolution over time: Weekly Veeva CRM activity volume broken down by the channel of engagement (in-person, phone, video, email, chat or text)
- Channel mix: Total Veeva CRM activity volume broken out by engagement channel percentage, calculated using percent change during the specified period
- Weekly activities per user: The average weekly number of Veeva CRM activities submitted per number of users active in Veeva CRM
- Approved email volume: The average weekly volume of approved emails sent via Veeva CRM, calculated using percent change during the specified period
- Email open rate: Percentage of approved emails opened at least once out of all approved emails sent via Veeva CRM
- Email click rate: Percentage of approved emails clicked at least once out of all approved emails sent via Veeva CRM
- In-person % CLM usage: Percentage of in-person engagements that leveraged content in Veeva CRM
- Video % CLM usage: Percentage of video engagements that leveraged content in Veeva CRM
- Veeva CRM Engage meeting % CLM usage: Percentage of Veeva CRM Engage meetings that leveraged content in Veeva CRM
- Veeva CRM Engage meeting duration: The average duration of Veeva CRM Engage meetings in minutes
Engagement channel definitions
- In-person: Submitted calls with a CRM Standard Metrics call channel value of ‘in-person’
- Phone: Submitted calls with a CRM Standard Metrics call channel value of ‘phone’
- Video: Veeva CRM Engage calls and video calls via other platforms that are then recorded as calls in Veeva CRM with a Standard Metrics call channel value of ‘video’
- Email: Approved emails and emails sent via other platforms that are then recorded as calls in Veeva CRM with a Standard Metrics call channel value of ‘email’
- Chat or text: Submitted calls with a CRM Standard Metrics call channel value of ‘chat or text’
User type definitions
- Sales: Users that have been classified with the ‘sales’ value in the CRM Standard Metrics user type field
- Key account manager: Users that have been classified with the ‘key account manager’ value in the CRM Standard Metrics user type field
- Medical: Users that have been classified with the ‘medical’ value in the CRM Standard Metrics user type field
Region definitions
- Global: All markets globally. This quarter’s global trends report omits data from China.
- Europe: Albania, Andorra, Armenia, Aruba, Austria, Azerbaijan, Belarus, Belgium, Bermuda, Bosnia and Herzegovina,
Bulgaria, Croatia, Cyprus, Czech Republic, Denmark, Estonia, Finland, France, French Polynesia, Georgia, Germany,
Greece, Greenland, Guadeloupe, Guernsey, Hungary, Ireland, Italy, Jersey, Latvia, Lithuania, Luxembourg, Macedonia,
Malta, Martinique, Republic of Moldova, Monaco, Montenegro, Netherlands, New Caledonia, Norway, Poland, Portugal,
Romania, Serbia, Slovakia, Slovenia, Spain, Sweden, Switzerland, Ukraine, United Kingdom - Asia: Australia, Bangladesh, Bhutan, Brunei Darussalam, Cambodia, Cocos (Keeling) Islands, Indonesia, Japan,
Kazakhstan, Republic of Korea, Kyrgyzstan, Malaysia, Mongolia, Myanmar, Nauru, Nepal, New Zealand, Philippines,
Samoa, Singapore, Solomon Islands, Sri Lanka, Taiwan, Tajikistan, Thailand, Turkmenistan, Uzbekistan, Vietnam - Latin America: Antigua and Barbuda, Argentina, Bahamas, Barbados, Belize, Bolivia, Brazil, Chile, Colombia, Costa
Rica, Cuba, Dominican Republic, Ecuador, El Salvador, Guatemala, Guyana, Haiti, Honduras, Jamaica, Mexico,
Nicaragua, Panama, Paraguay, Peru, Trinidad and Tobago, Uruguay, Venezuela
Methodology
The Veeva Pulse Field Trends Report is a quarterly industry benchmark for global and regional healthcare
professional (HCP) engagement across the life sciences industry. The findings are based on:
- Approximately 600 million annual global field activities captured in Veeva CRM and Veeva CRM Engage.
- Marketing effectiveness data from Veeva Crossix. Crossix connects anonymized health data on 300+ million patients to media data to measure the impact of direct-to-consumer and HCP marketing investments in the U.S.
- Anonymous patient longitudinal claims data from Veeva Compass Patient covering dispensed prescriptions, procedures, and diagnoses from 300+ million patients.
- 4+ million profiles containing publications, clinical trials, conferences, associations, guidelines, grants, payments, social media, news mentions, and patient mix by disease and drug class from Veeva Link Key People in 85+ countries and all major therapeutic areas.
- Global reference data of HCPs, healthcare organizations, and affiliations from Veeva OpenData, containing addresses, emails, specialties, demographics, and compliance data (license information and industry identifiers) in 100+ countries.
The Veeva Pulse Field Trends Report delivers insights that inform the industry and help field teams align their
strategy to key market trends for improved commercial success. The global Veeva Business Consulting team also
helps customers inform their strategies using industry benchmarking with Veeva Pulse data.