HCP에 대한 엑세스가 감소하고 있는 상황에서도, 옴니채널로 통합된 고객 인게이지먼트를 활용하는 것은 이점이 됩니다.
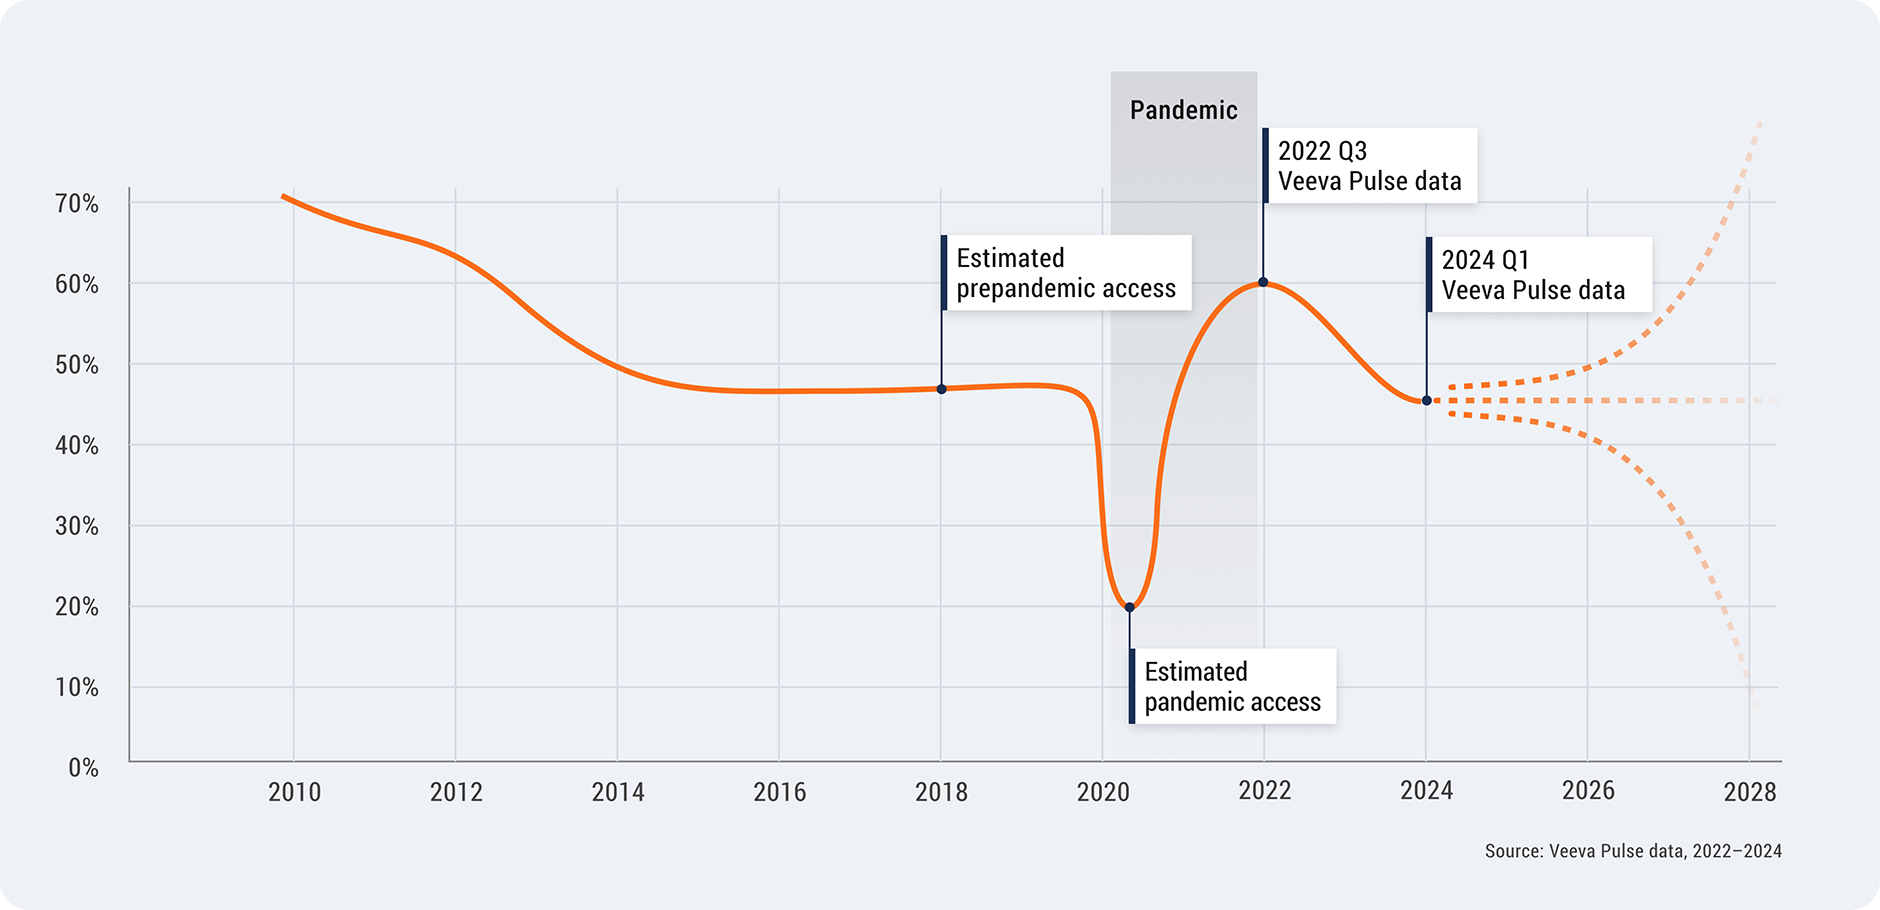
18개월 전, 바이오제약 기업은 60%의 HCP과 인게이먼트가 가능하였지만, 현재는 45% 수준에 불과합니다. 2022년에 업계가 경험했던 높은 접근 수준은 팬데믹 이후에 벌어진 이상 현상이었고, 이후 이러한 추세에서 다시 정상 수준으로 돌아오고 있는 것으로 파악됩니다. HCP도 이러한 경향과 마찬가지로 3개 이하의 바이오제약 기업과만 선택적으로 인게이지먼트를 진행하는 경향을 보이고 있습니다.
그럼에도 불구하고, 바이오제약 기업들은 HCP와 그들의 이같이 제한된 시간을 최대한 활용할 수 있는 새로운 방법을 찾고 있습니다. 또한 인게이지먼트가 가능한 HCP의 범위나 방문횟수와 같은 전통적인 성과 측정방식을 넘어선 각각의 HCP에게 필요한 것을 시기적절하게 제공하기 위해 어떻게 우선순위화 할 것인지에 대한 새로운 모델들이 지속적으로 개발되고 있는 것을 확인할 수 있습니다.
HCP가 필요로 하는 시점에 필요한 컨텐츠를 제공할 수 있도록 개인화, 실시간 커뮤니케이션 채널, 연관성 있는 컨텐츠들의 중요성이 점점 증가하고 있습니다. 그리고 세일즈, 마케팅, 메디컬이 통합적으로 연결되어 고객에게 일관된 인게이지먼트를 제공하는 것은 필드 팀과 HCP 사이에 수준 높은 신뢰 관계를 구축할 수 있도록 합니다.
Veeva HCP 자문위원회의 자문위원인 비뇨기과 전문의 Dr. Vital Hevia는 다음과 같이 이야기합니다.
“환자에게 가장 맞는 치료의 효과를 얻기위해 , 신뢰할 수 있는 고품질의 제품 정보, HCP를 위한 학술 교육, 연구 결과를 통한 인사이트 등 3가지를 바이오제약 업계가 제공해 주기를 기대합니다. 의사들에게는 새로운 정보들이 지속적으로 제공되어 교육되어야 하며, 바이오제약 인더스트리와의 모든 상호작용은 다음 커뮤니케이션의 내용에 반영되어야 합니다.”
Veeva Business Consulting 팀이 제공하는 심층 분석을 통해 세일즈, 마케팅, 메디컬 전반에 걸쳐 보다 연결된 접근 방식으로 HCP 관계를 확장하고, 환자에게 필요한 의약품을 제공할 수 있는 방법을 알아보시기 바랍니다.
Thank you,

Dan Rizzo
Global Head of Veeva Business Consulting

HCP access declined from 60% to 45%
HCP access in the U.S. is back to pre-pandemic levels, dropping from 60% in 2022 to 45% in 2024.
A number of underlying factors continue to influence decreasing HCP access — including
increased market consolidation, health system restrictions, growing patient loads, and the
diversity and complexity of modern medicine.
U.S. HCP Access, 2010–2024
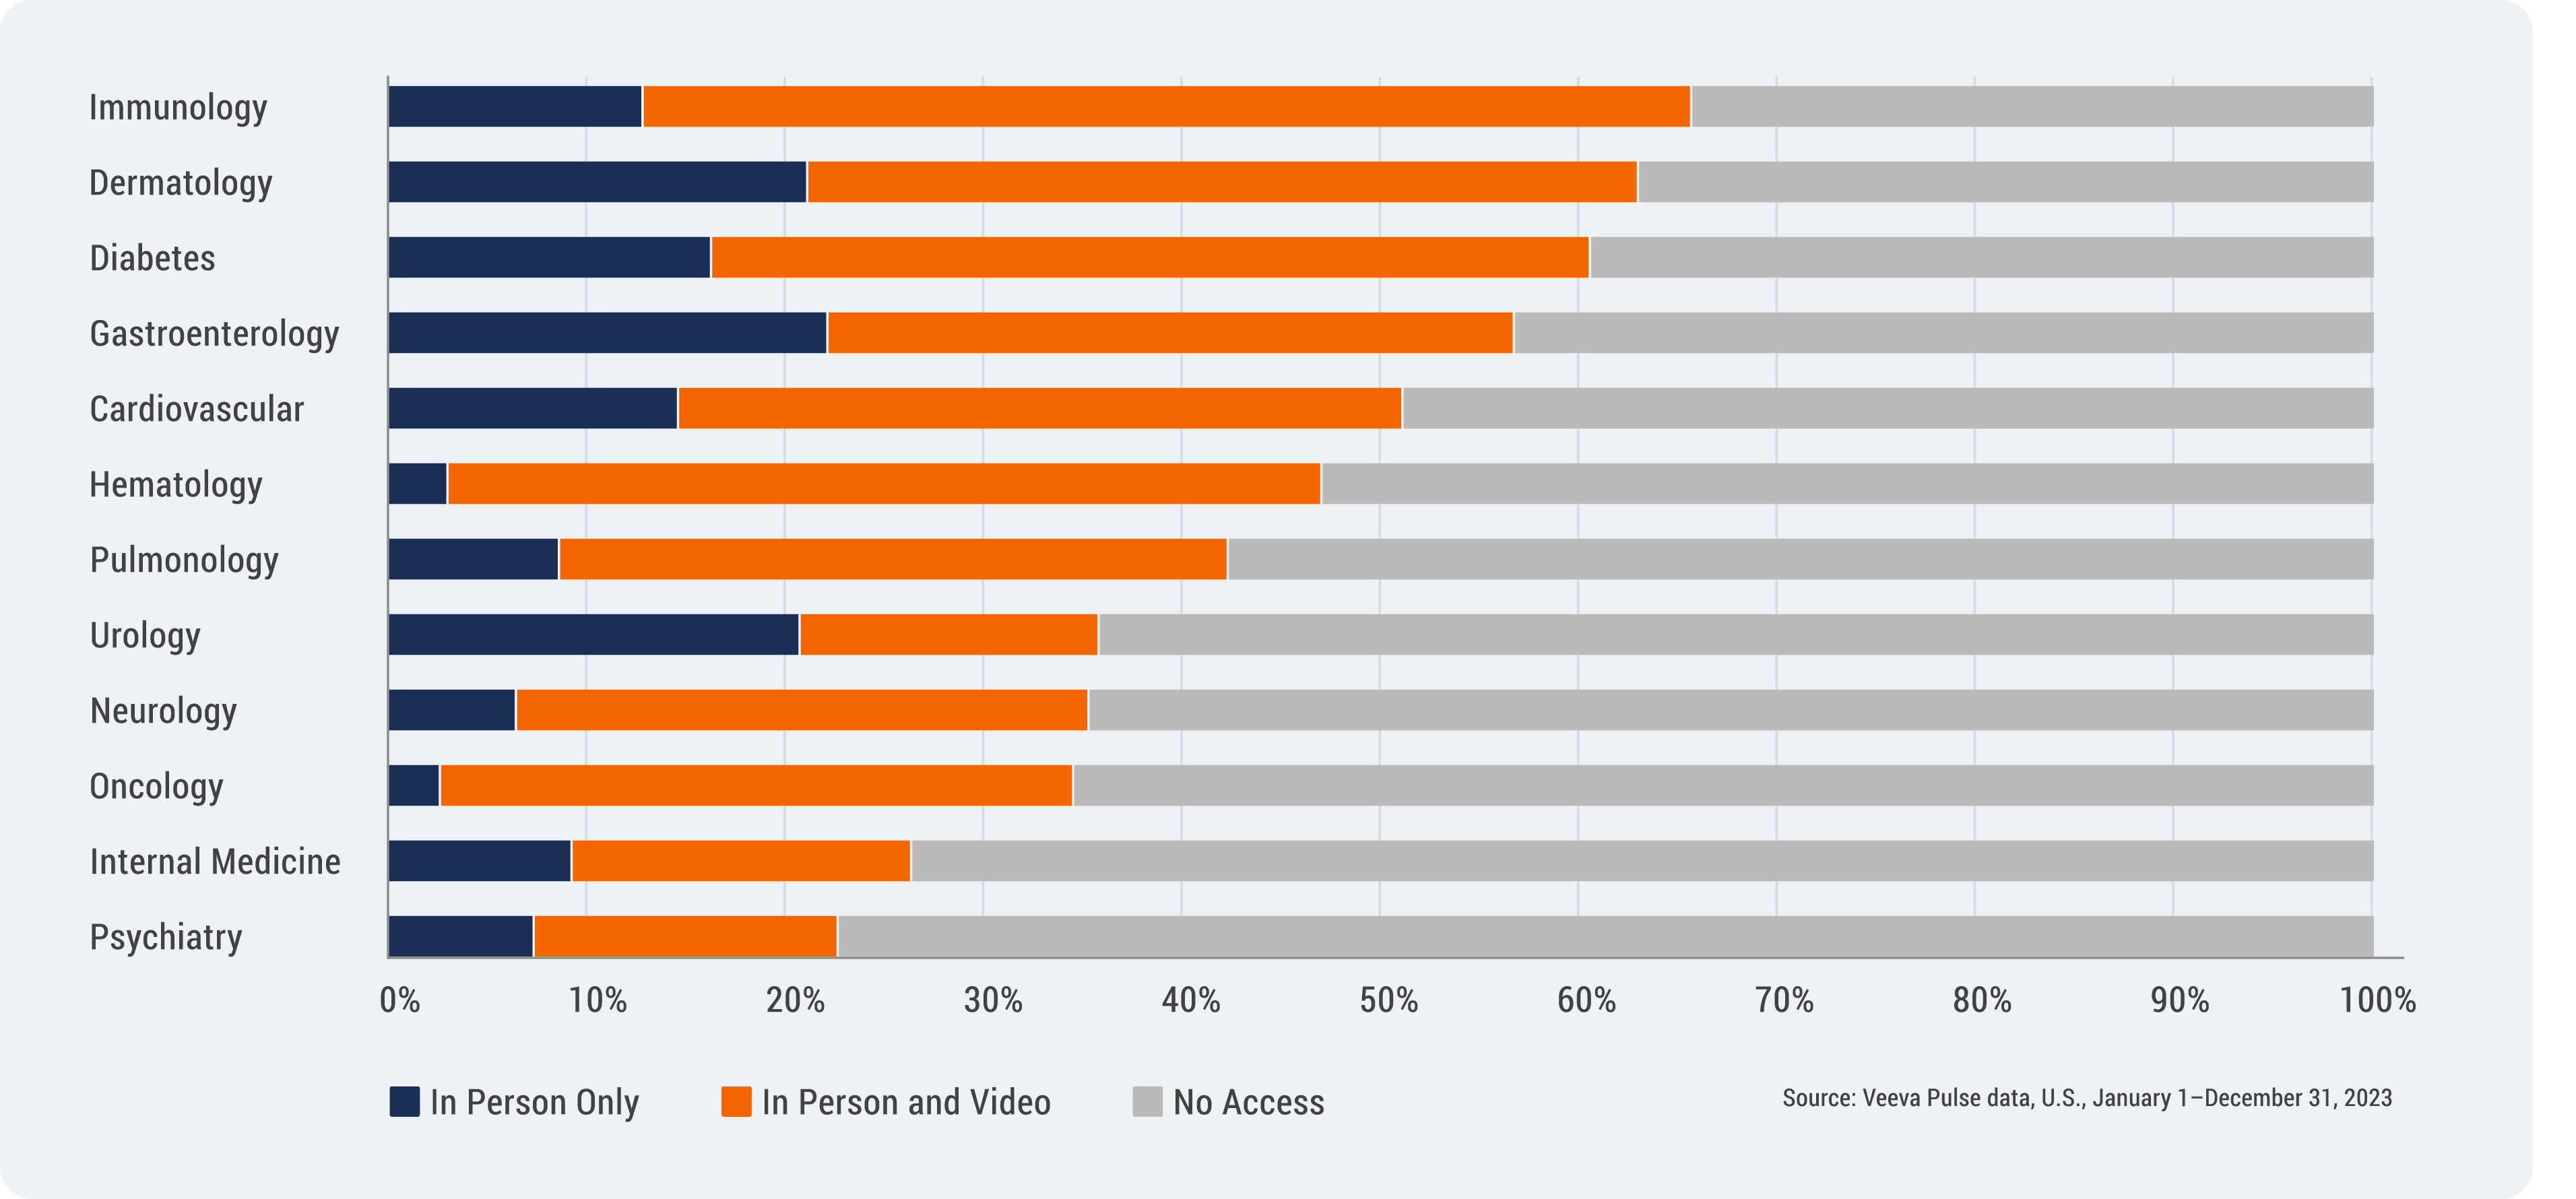
Access also varies greatly by specialty and channel, as seen in the figure below. The hardest-to-reach specialties are oncology, internal medicine, and psychiatry. HCPs who are accessible via both in-person and video represent an increasing share of overall access compared to prior years.
U.S. HCP Access by Top Specialty and Channel
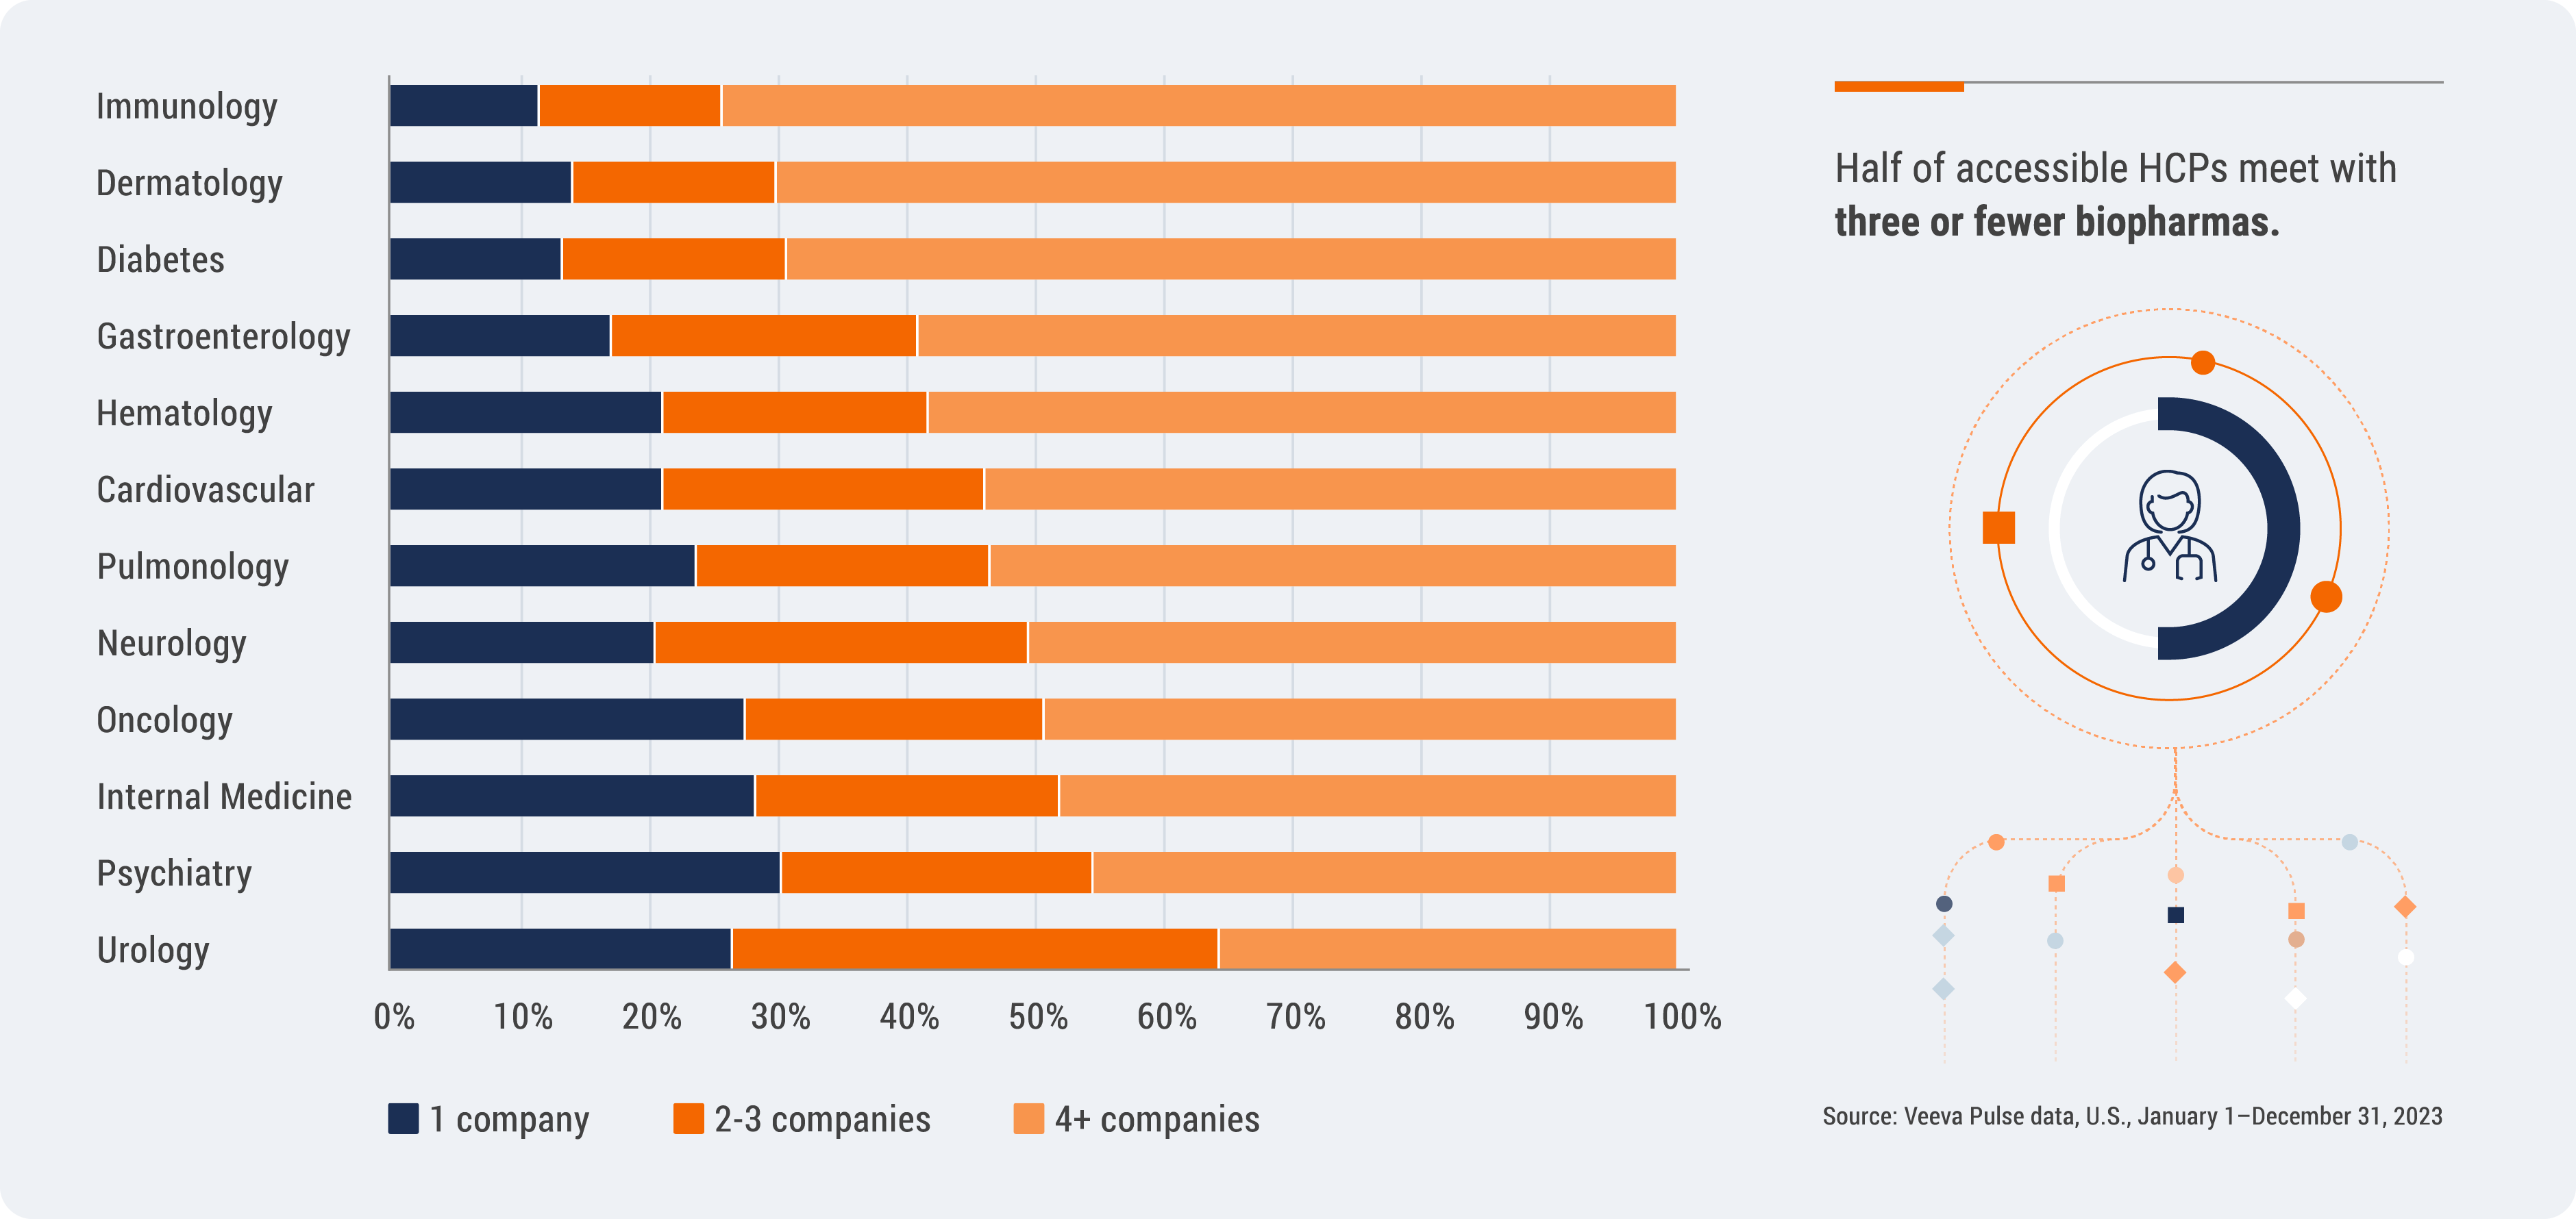
Half of accessible HCPs meet with three or fewer companies
HCPs remain highly selective when it comes to engagement with biopharmas — half of accessible HCPs meet with three or fewer companies. HCP access also varies greatly by specialty. Internal medicine, oncology, psychiatry, and urology remain the most restrictive specialties, with nearly 30% of HCPs restricting access to just one company.
U.S. HCP Selectivity by Top Specialty
Connected engagement models strengthen HCP relationships
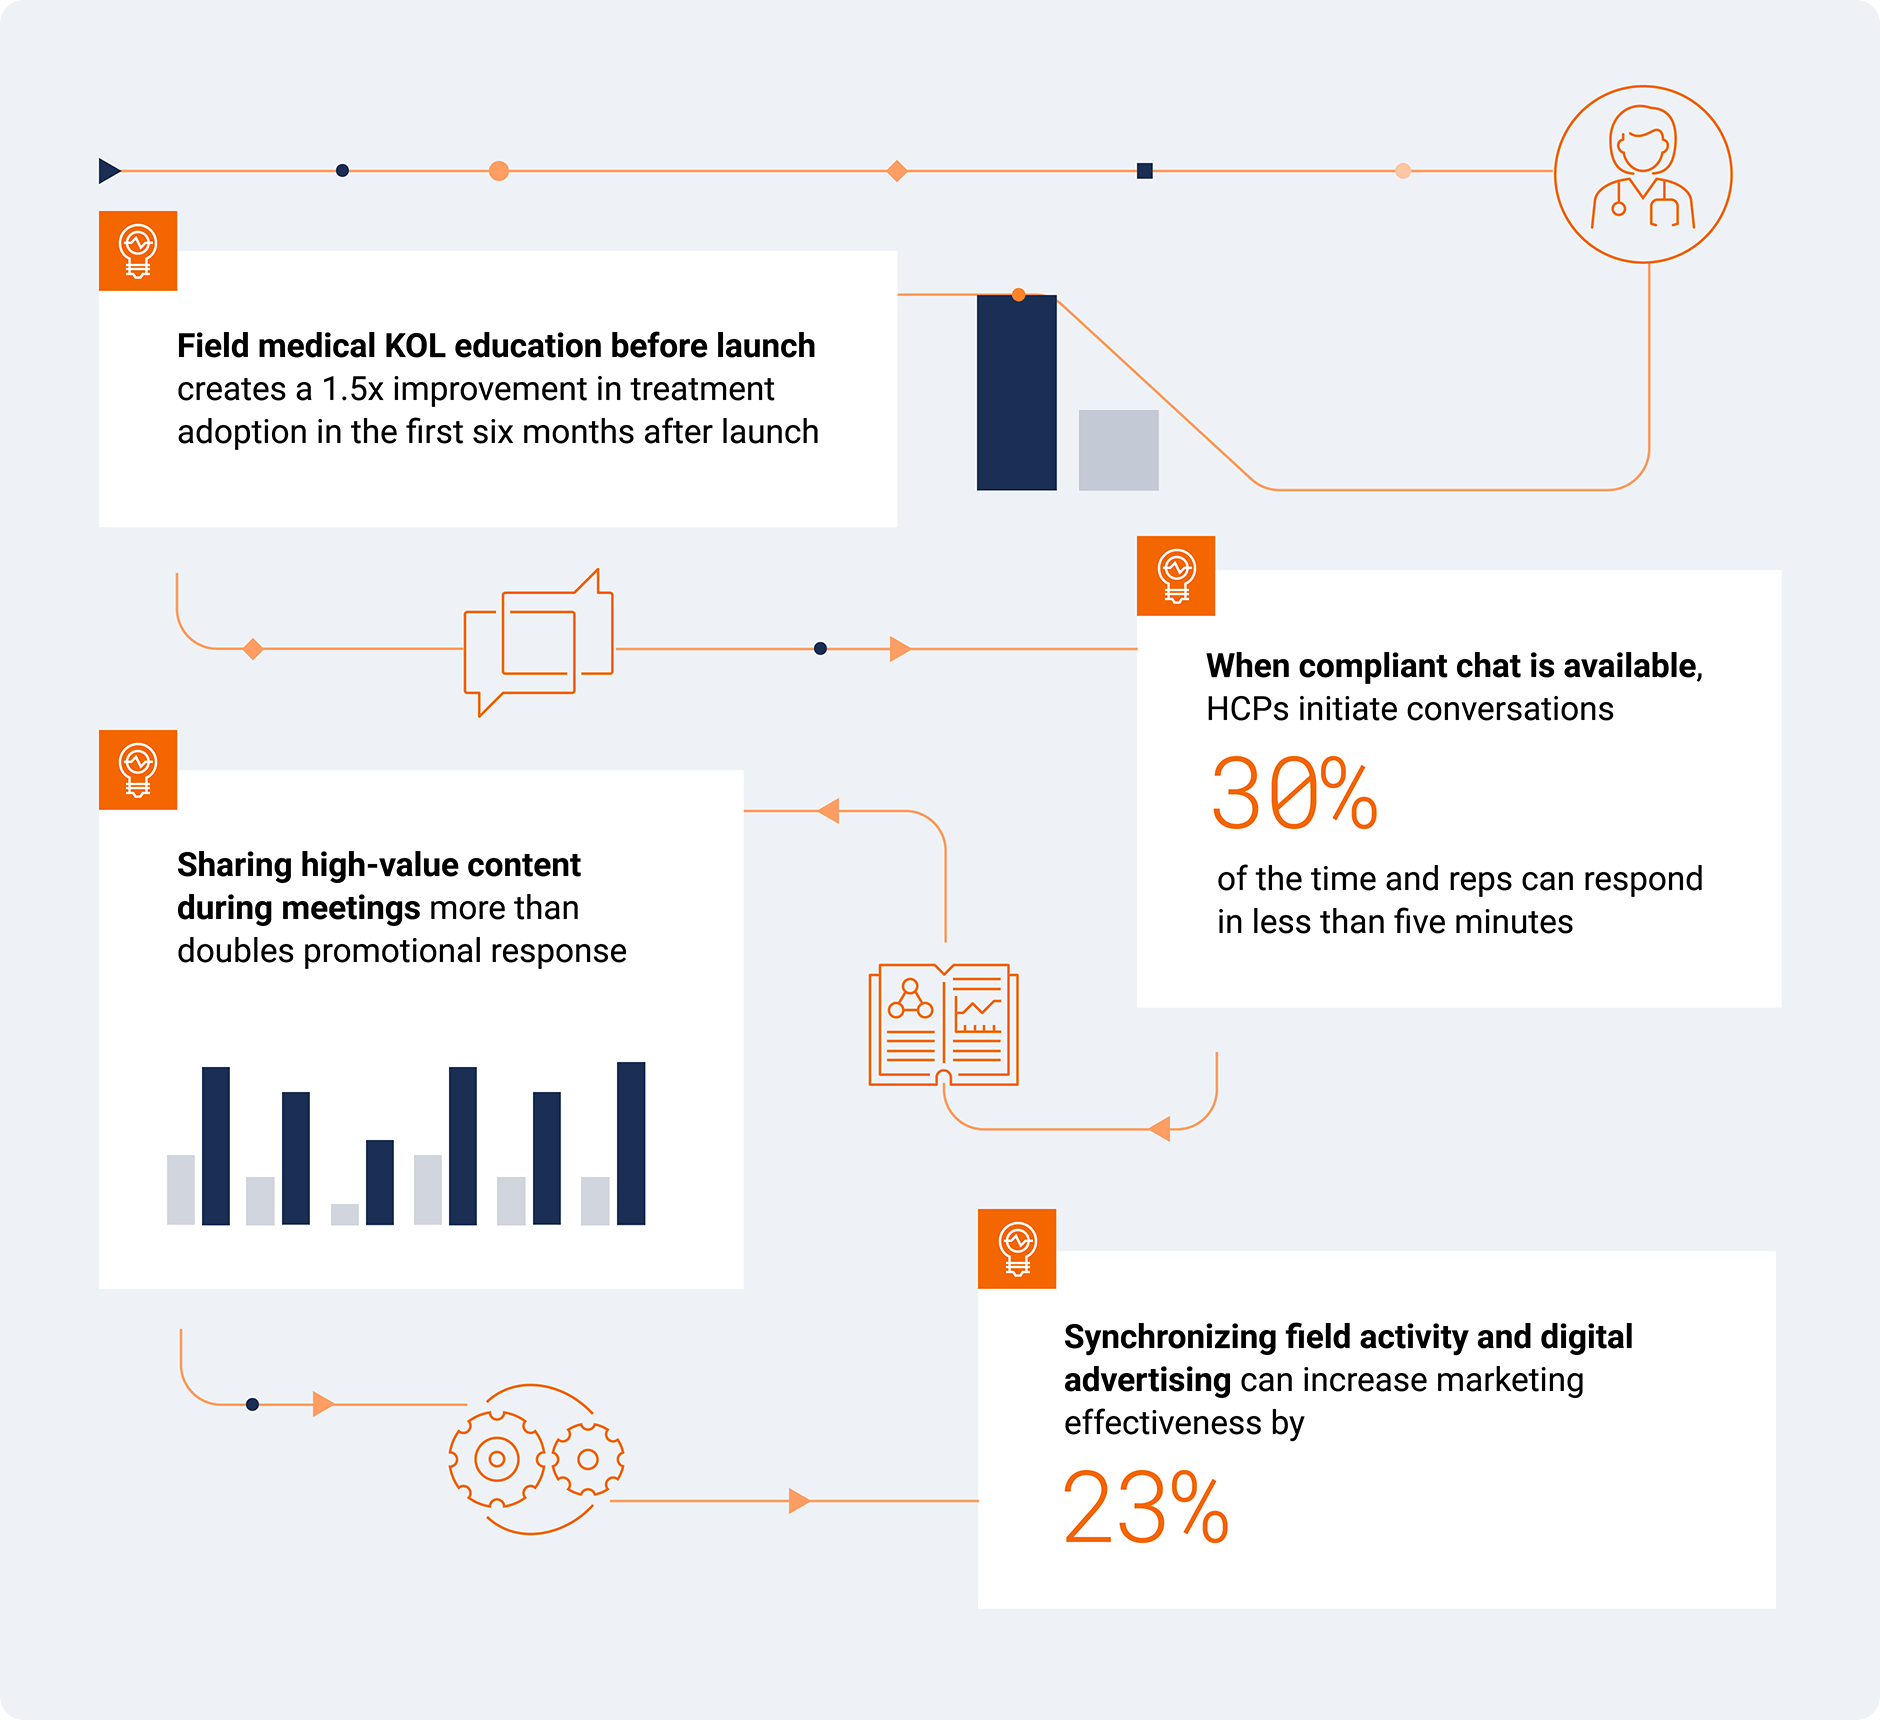
Although access has declined back to pre-pandemic levels, the way biopharmas engage HCPs has evolved significantly during this time. Connected engagement models — where sales, marketing, and medical work together seamlessly — are extending conversations with customers, responding more quickly to HCPs’ needs, and improving treatment adoption.
Now, there are early signs the industry is engaging HCPs in a more connected way. Here’s how a connected engagement model improves outcomes and delivers a better customer experience.
Connected HCP Engagement
Reach out to Veeva Business Consulting to find out how you can use Veeva Pulse data to create a coordinated approach across sales, marketing, and medical.
Global and Regional Trends
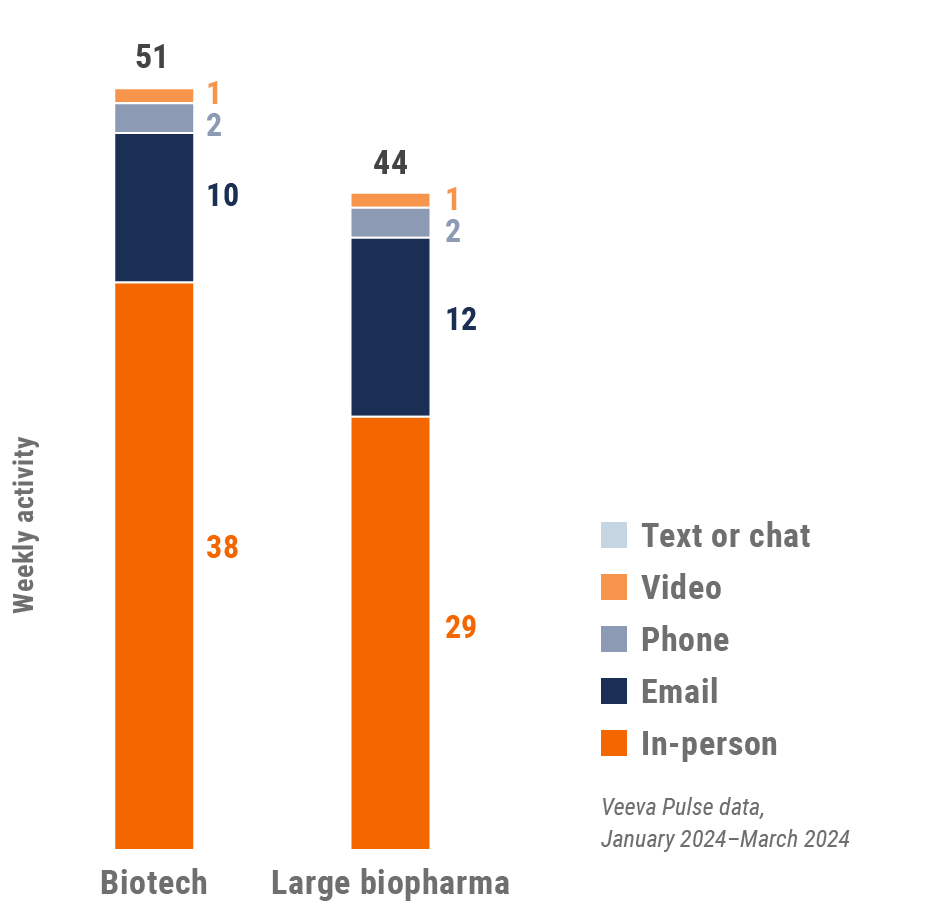
This report highlights global and regional field engagement trends from Veeva Pulse data gathered between January 2023 and March 2024. Veeva Pulse data is sourced from Veeva’s aggregated CRM activity, including field engagement stats from all instances of Veeva CRM globally. In this report, all comparisons are year-over-year, Q1 2023 to Q1 2024, unless otherwise noted.
Global trends
Figure 1: Channel mix evolution, global
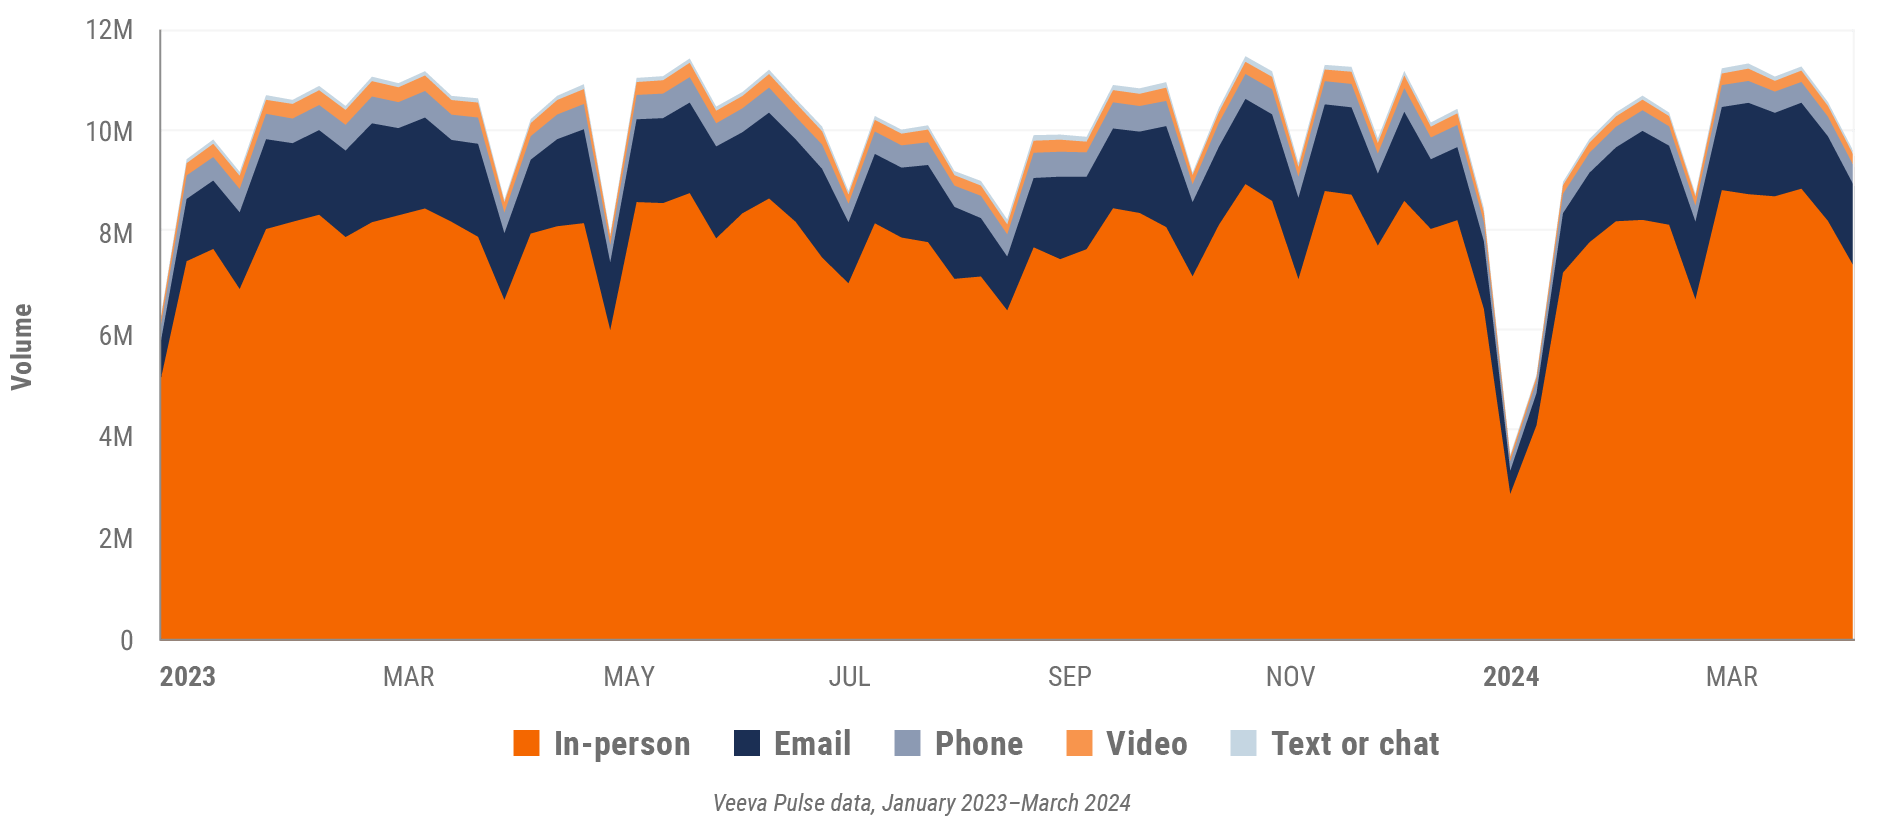
Figure 2: Channel mix, global

Global field team activity
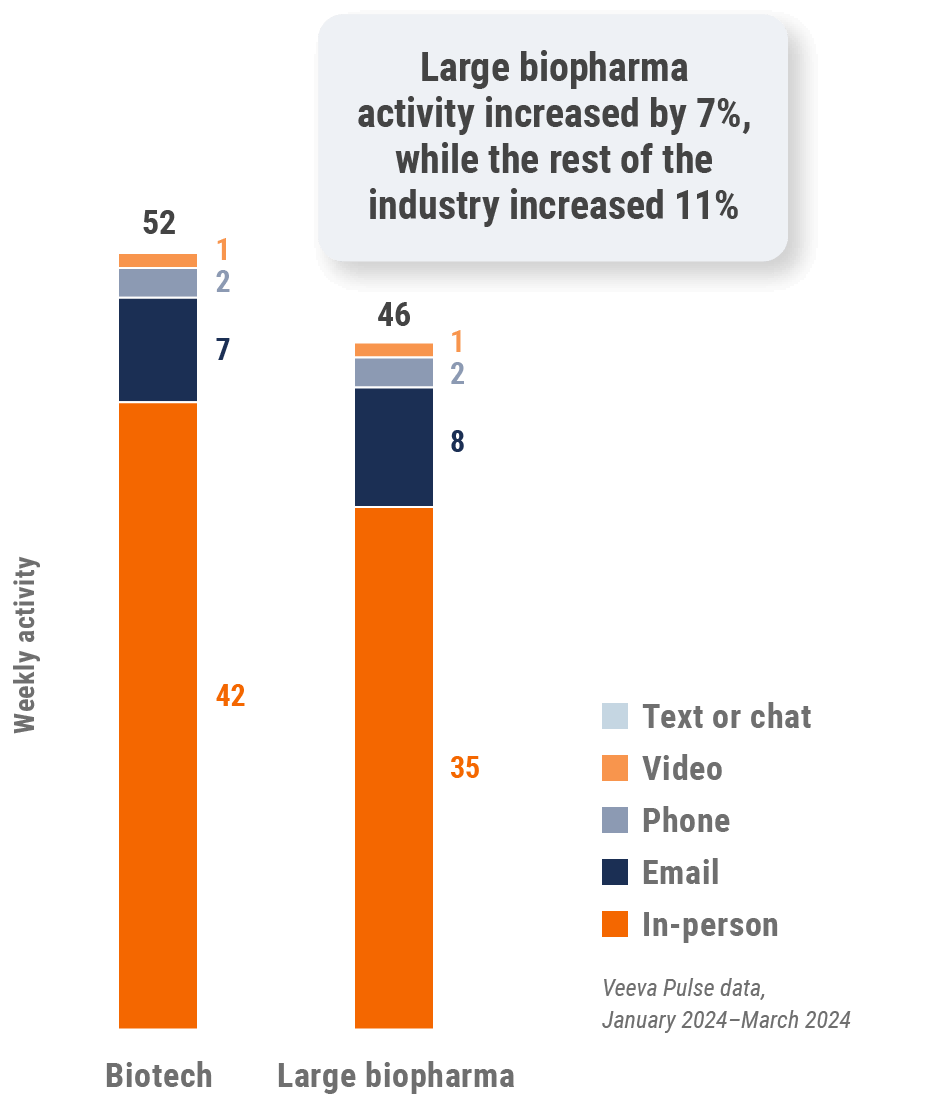
Weekly activity per user by engagement channel
Figure 3: Activity by region, global
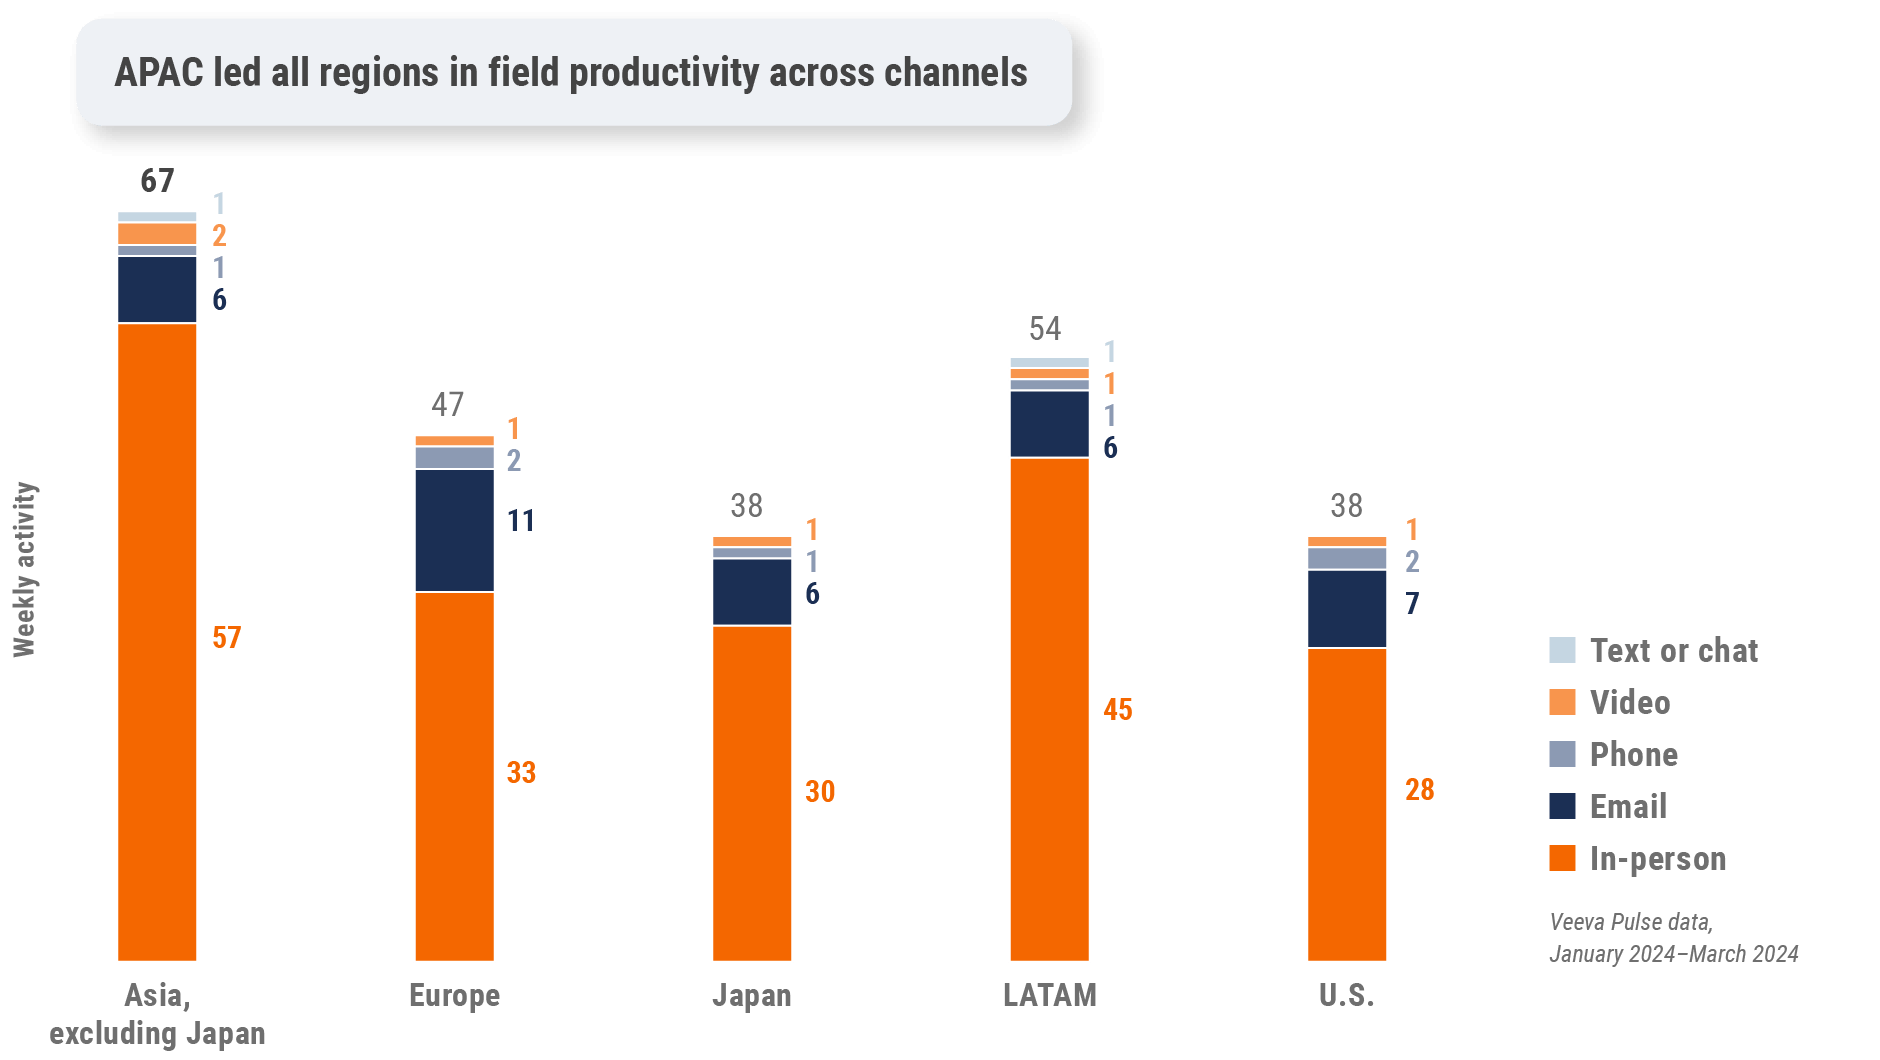
Figure 4: Activity by user type, global
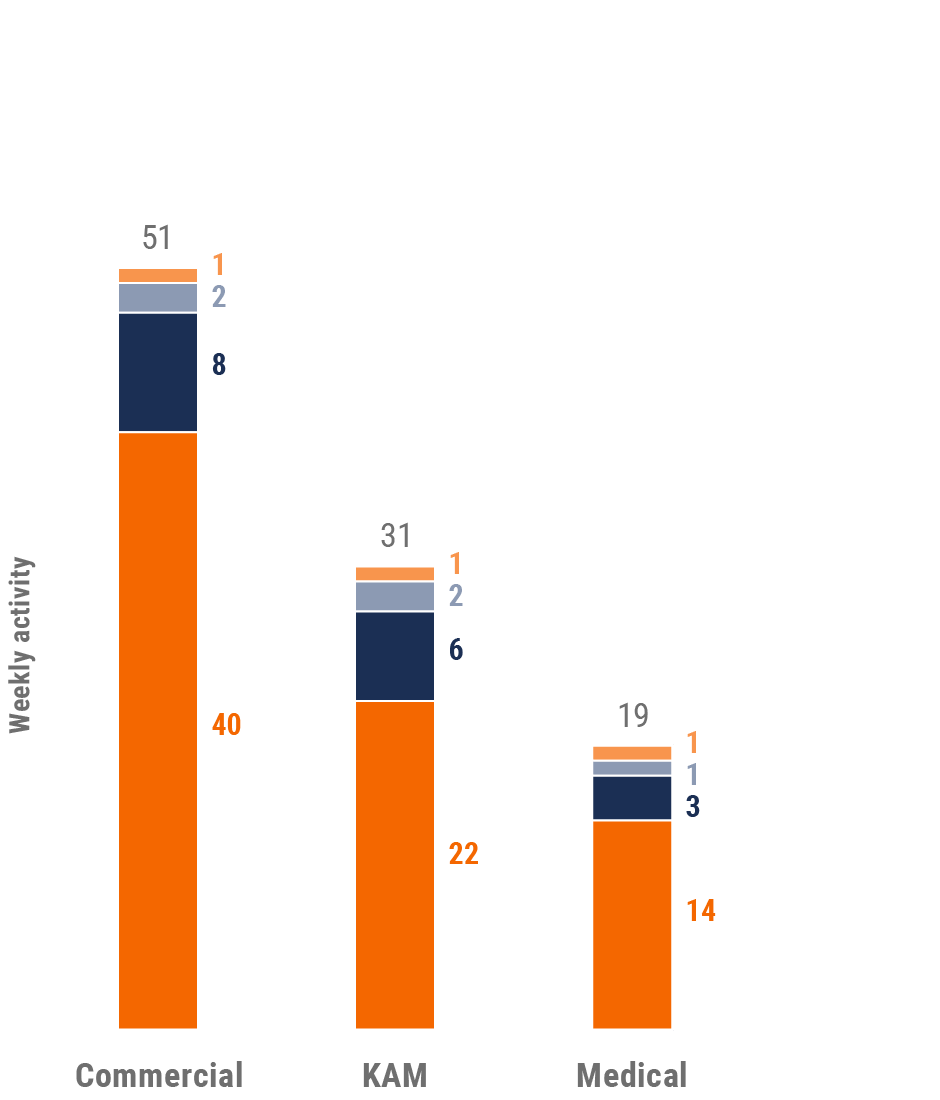
Figure 5: Activity by company size, global
Global engagement quality Consolidation of key quality metrics
Figure 6: Approved email volume, global
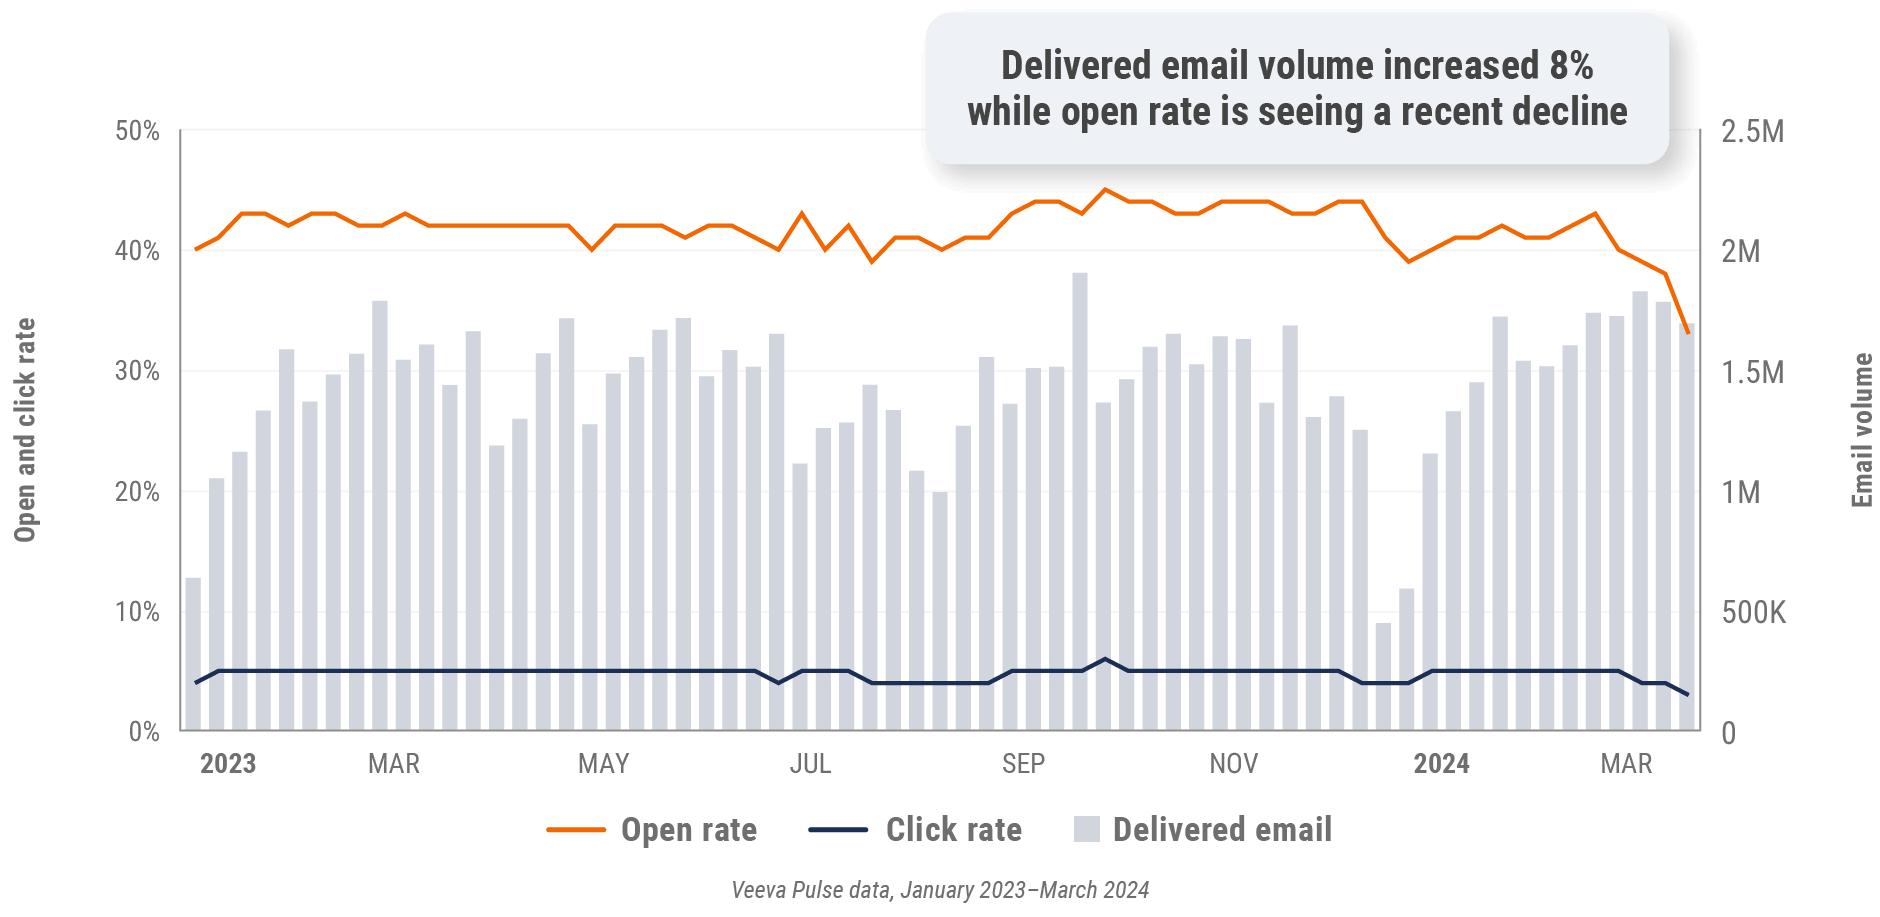
Figure 7: Content usage by channel, global
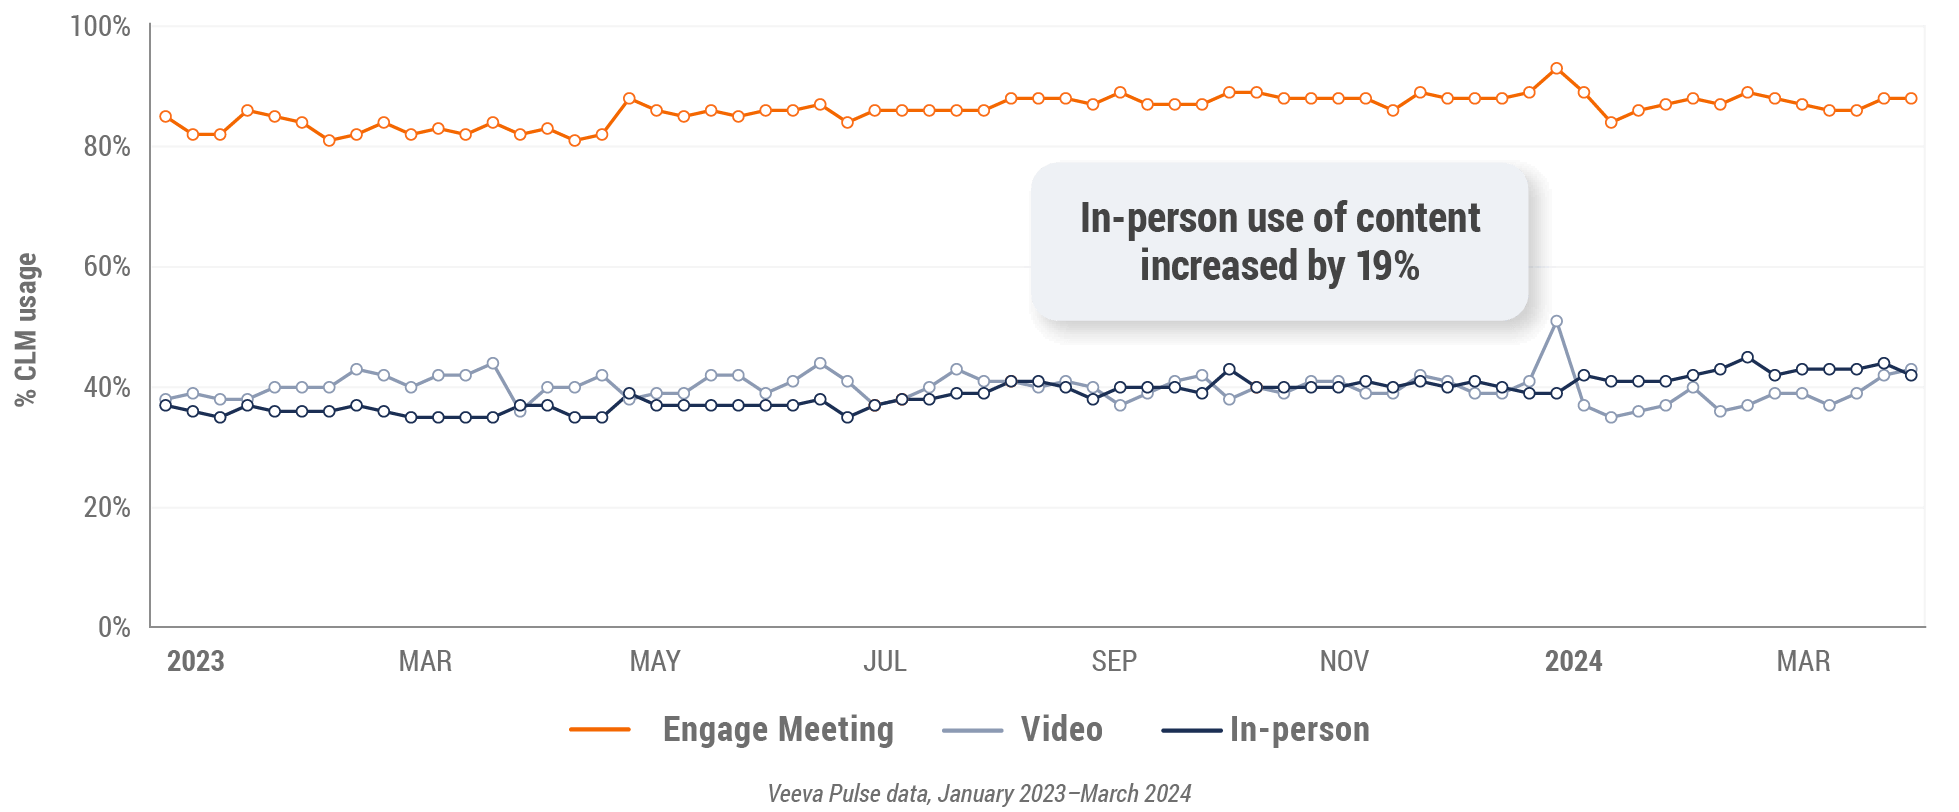
Figure 8: Veeva CRM Engage meeting duration, global

U.S. market trends
Figure 9: Channel mix evolution, U.S.
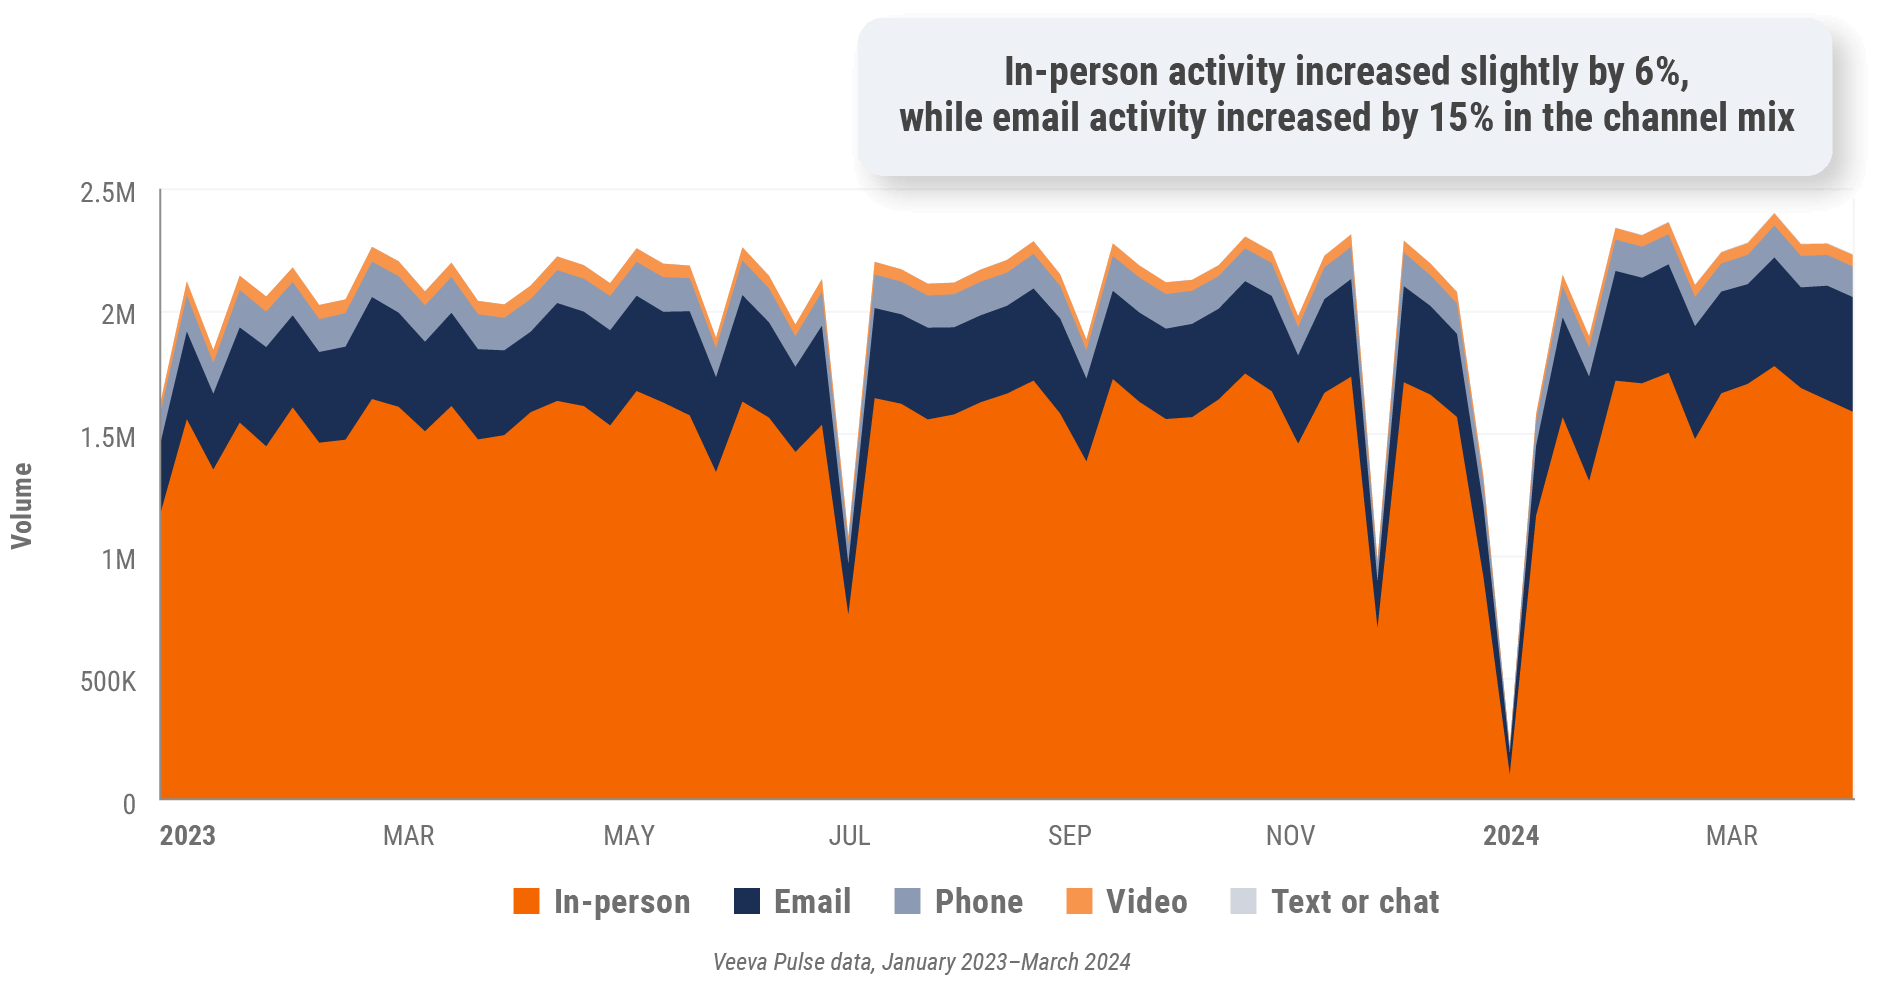
Figure 10: Channel mix, U.S.

U.S. field team activity Weekly activity per user by engagement channel
Figure 11: Activity, U.S.
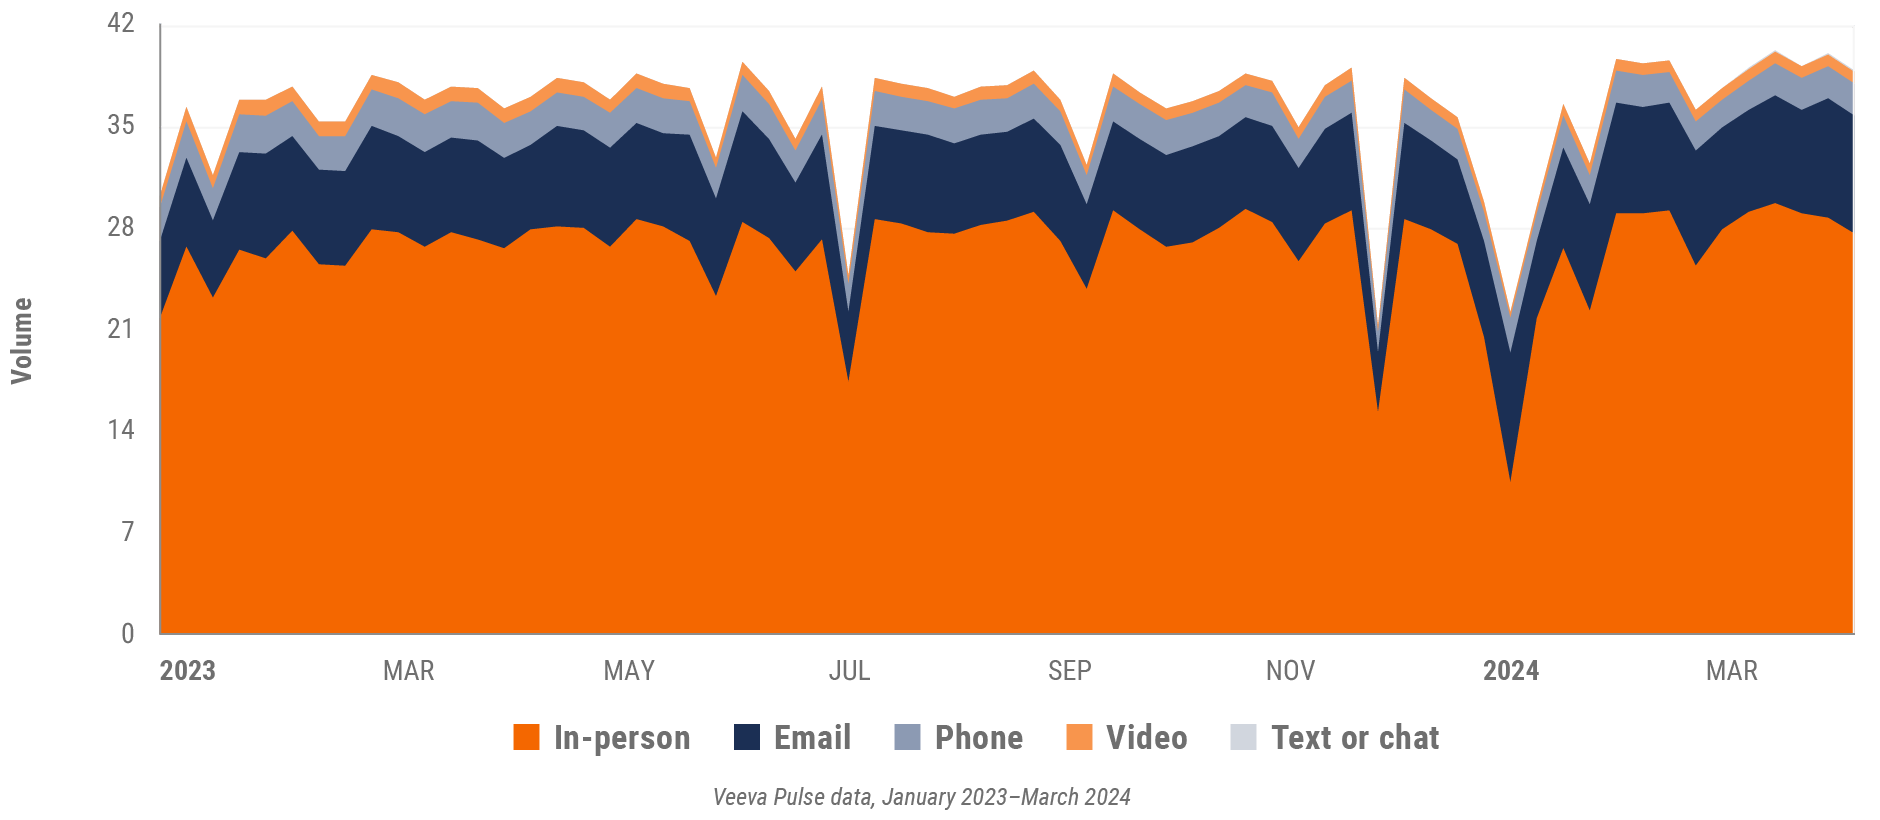
Figure 12: Activity by user type, U.S.
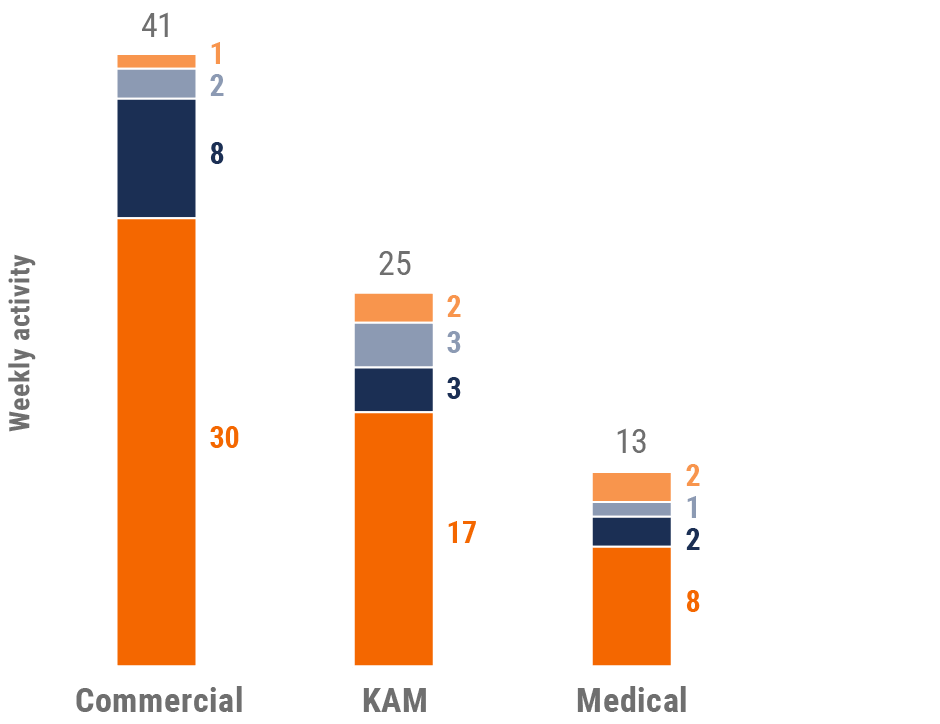
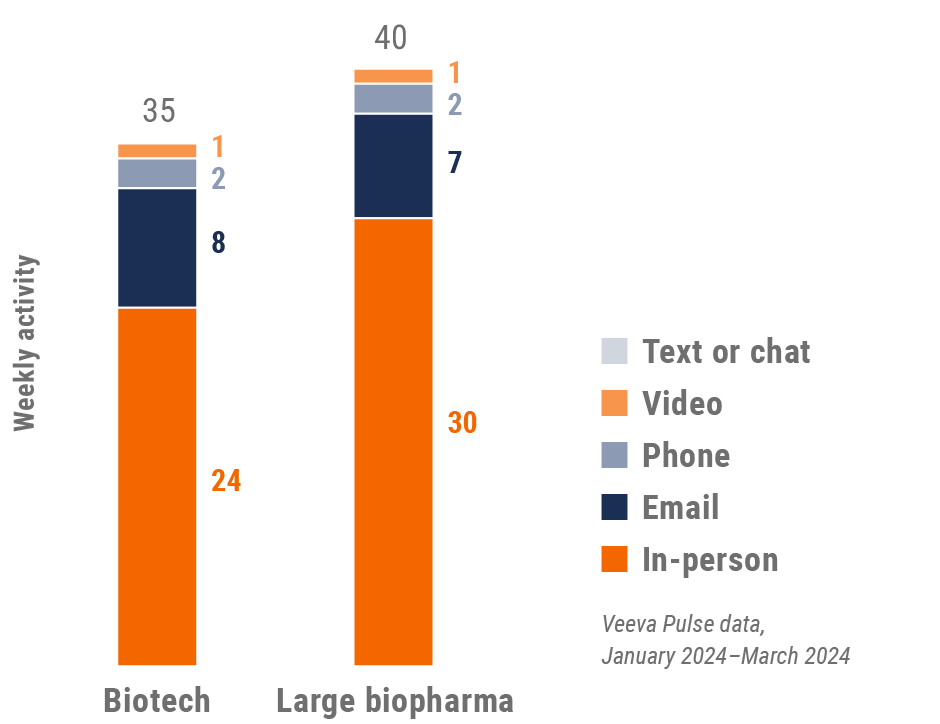
Figure 13: Activity by company size, U.S.
U.S. engagement quality Consolidation of key quality metrics
Figure 14: Approved email volume, U.S.
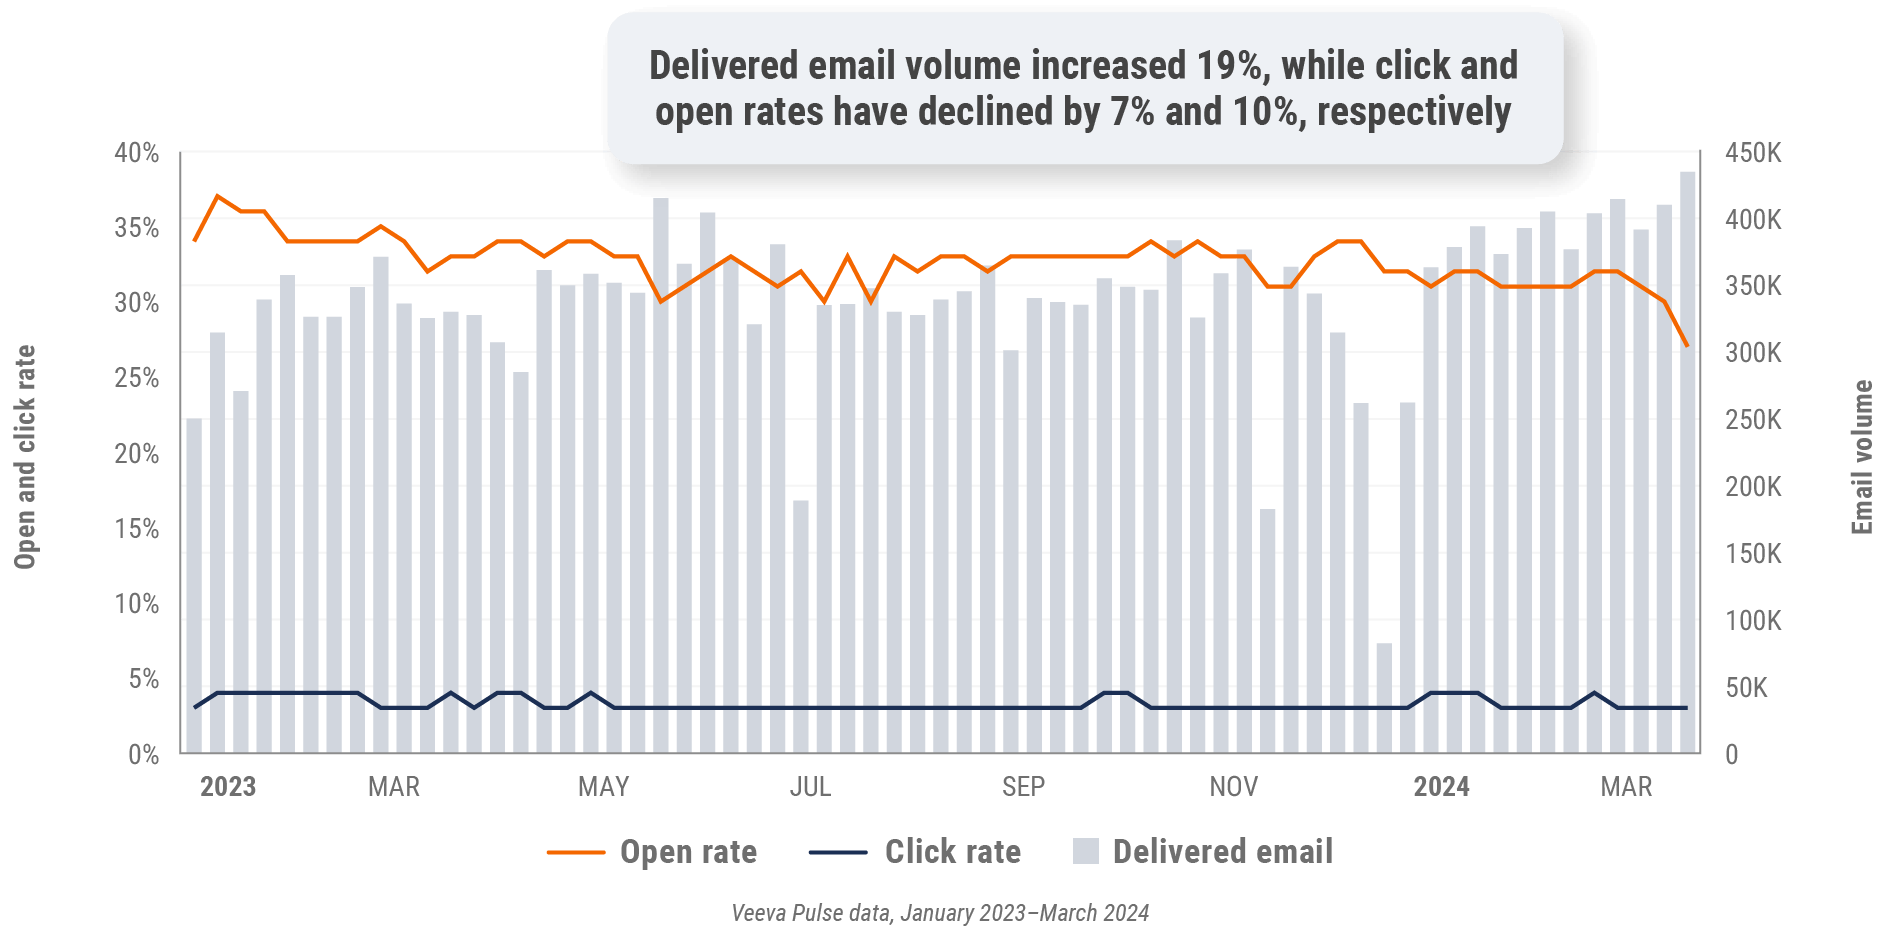
Figure 15: Content usage by channel, U.S.
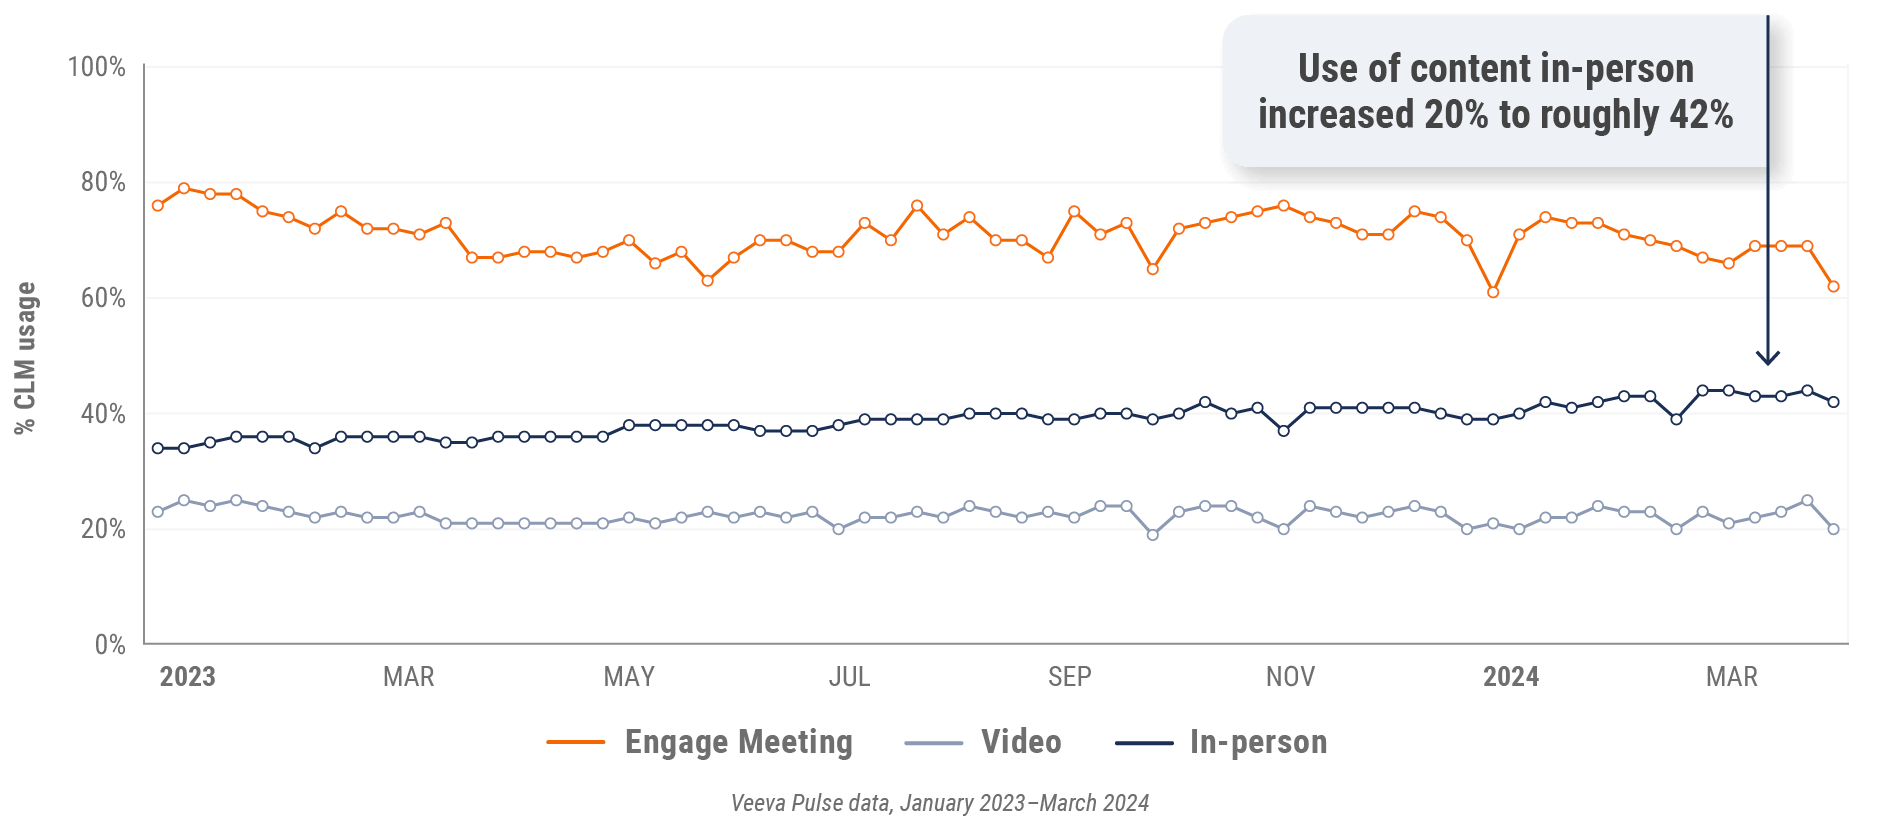
Figure 16: Veeva CRM Engage meeting duration, U.S.

Europe market trends
Figure 17: Channel mix evolution, Europe
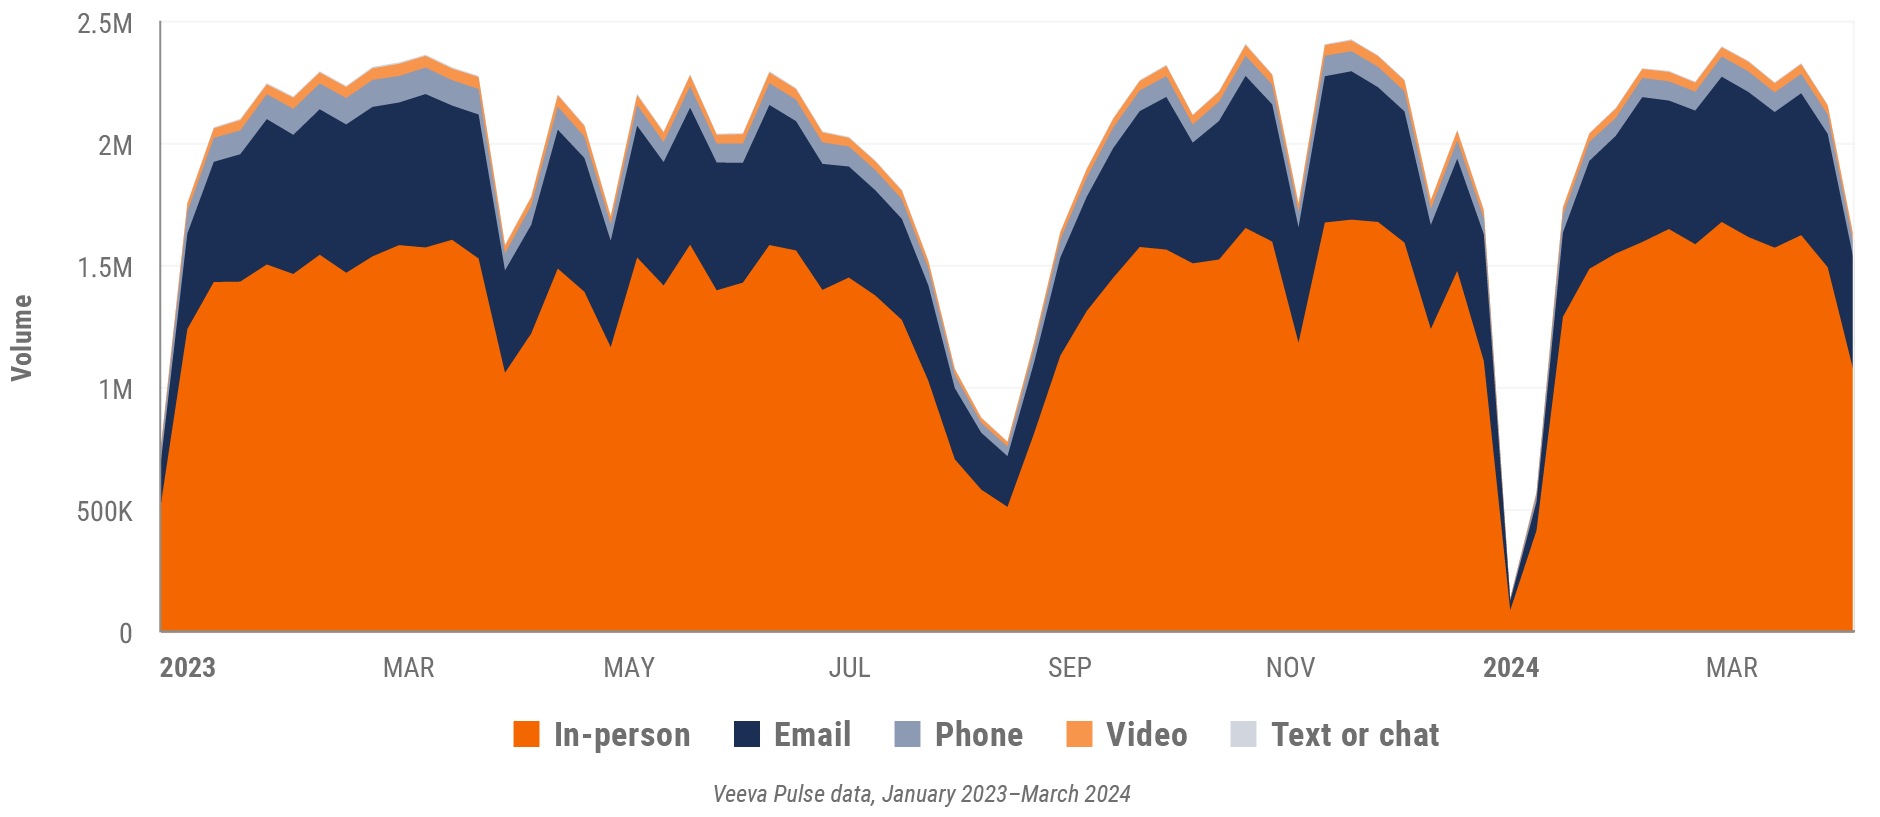
Figure 18: Channel mix, Europe

Europe field team activity Weekly activity per user by engagement channel
Figure 19: Activity by country, EU5
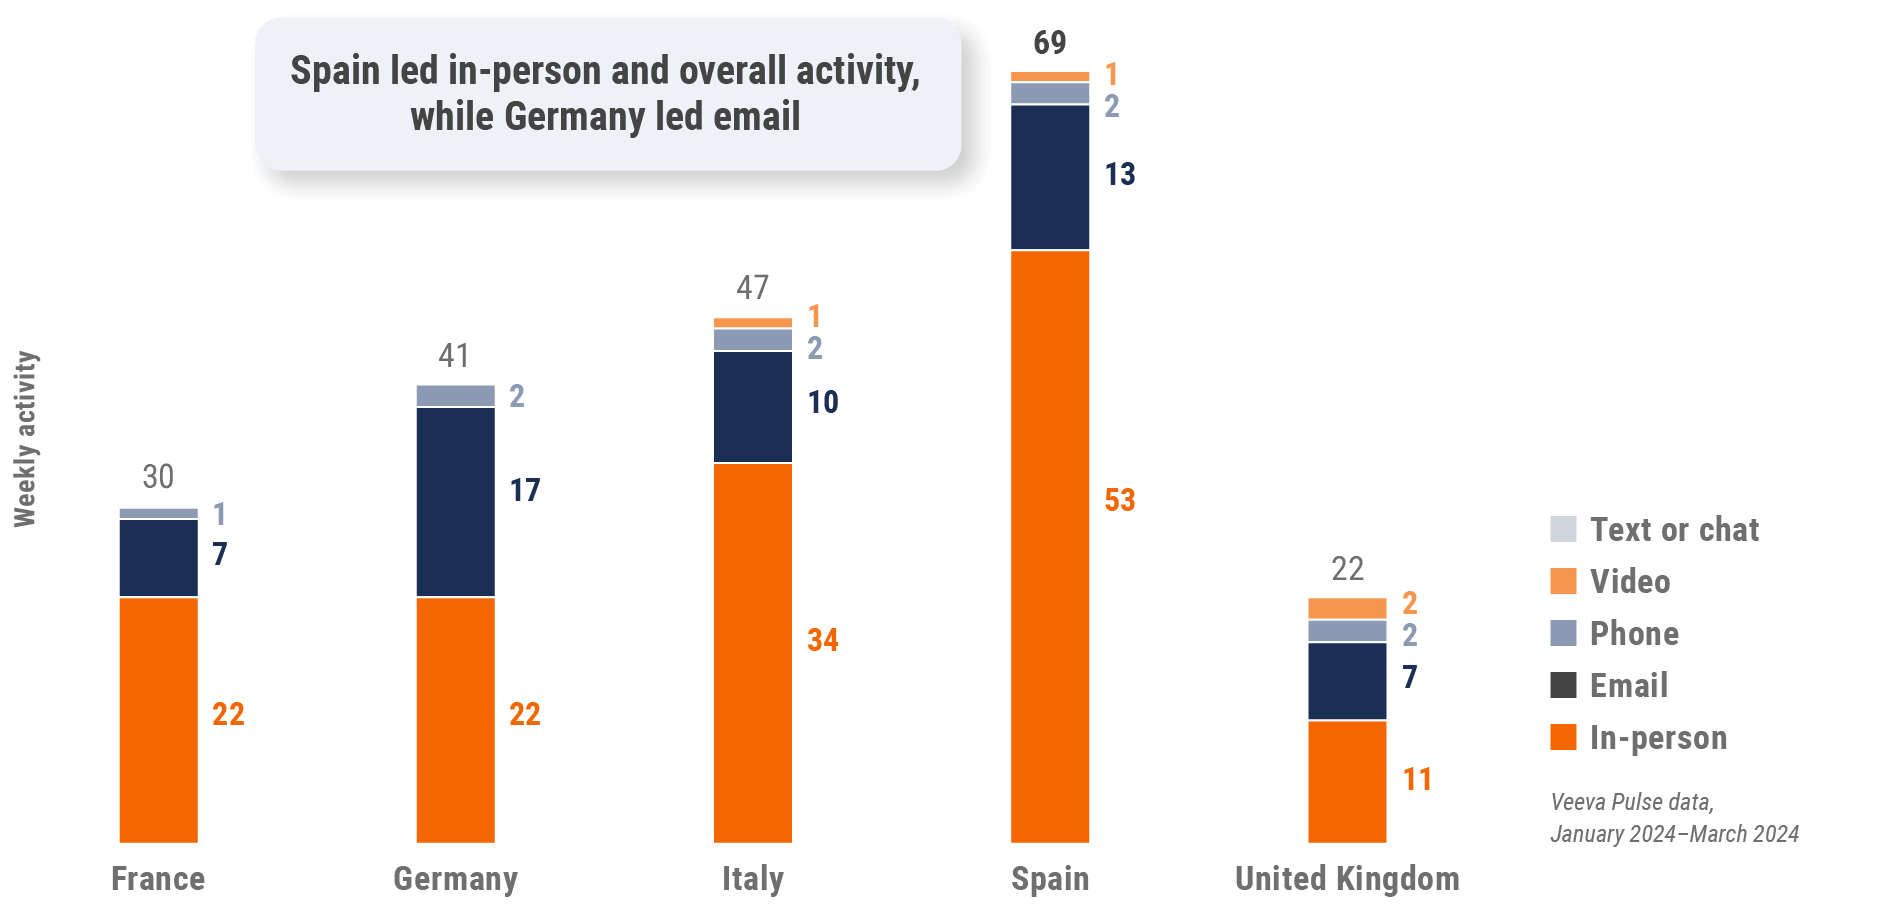
Figure 20: Activity by user type, Europe
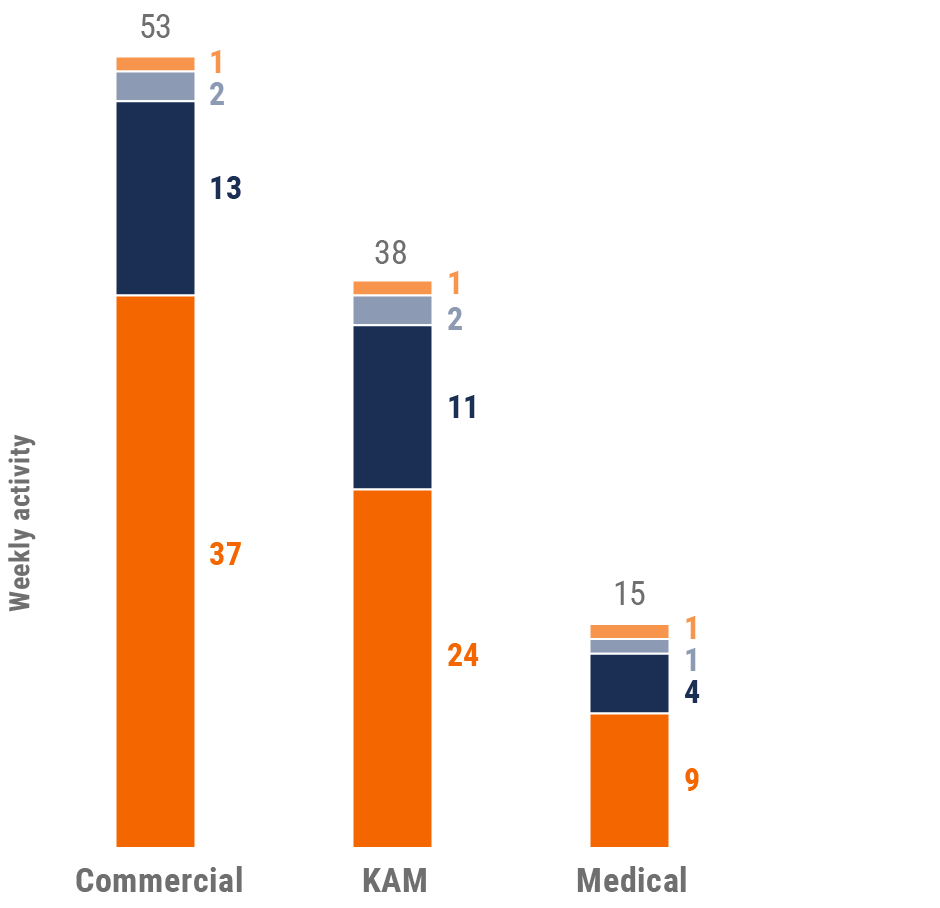
Figure 21: Activity by company size, Europe
Europe engagement quality Consolidation of key quality metrics
Figure 22: Approved email volume, Europe
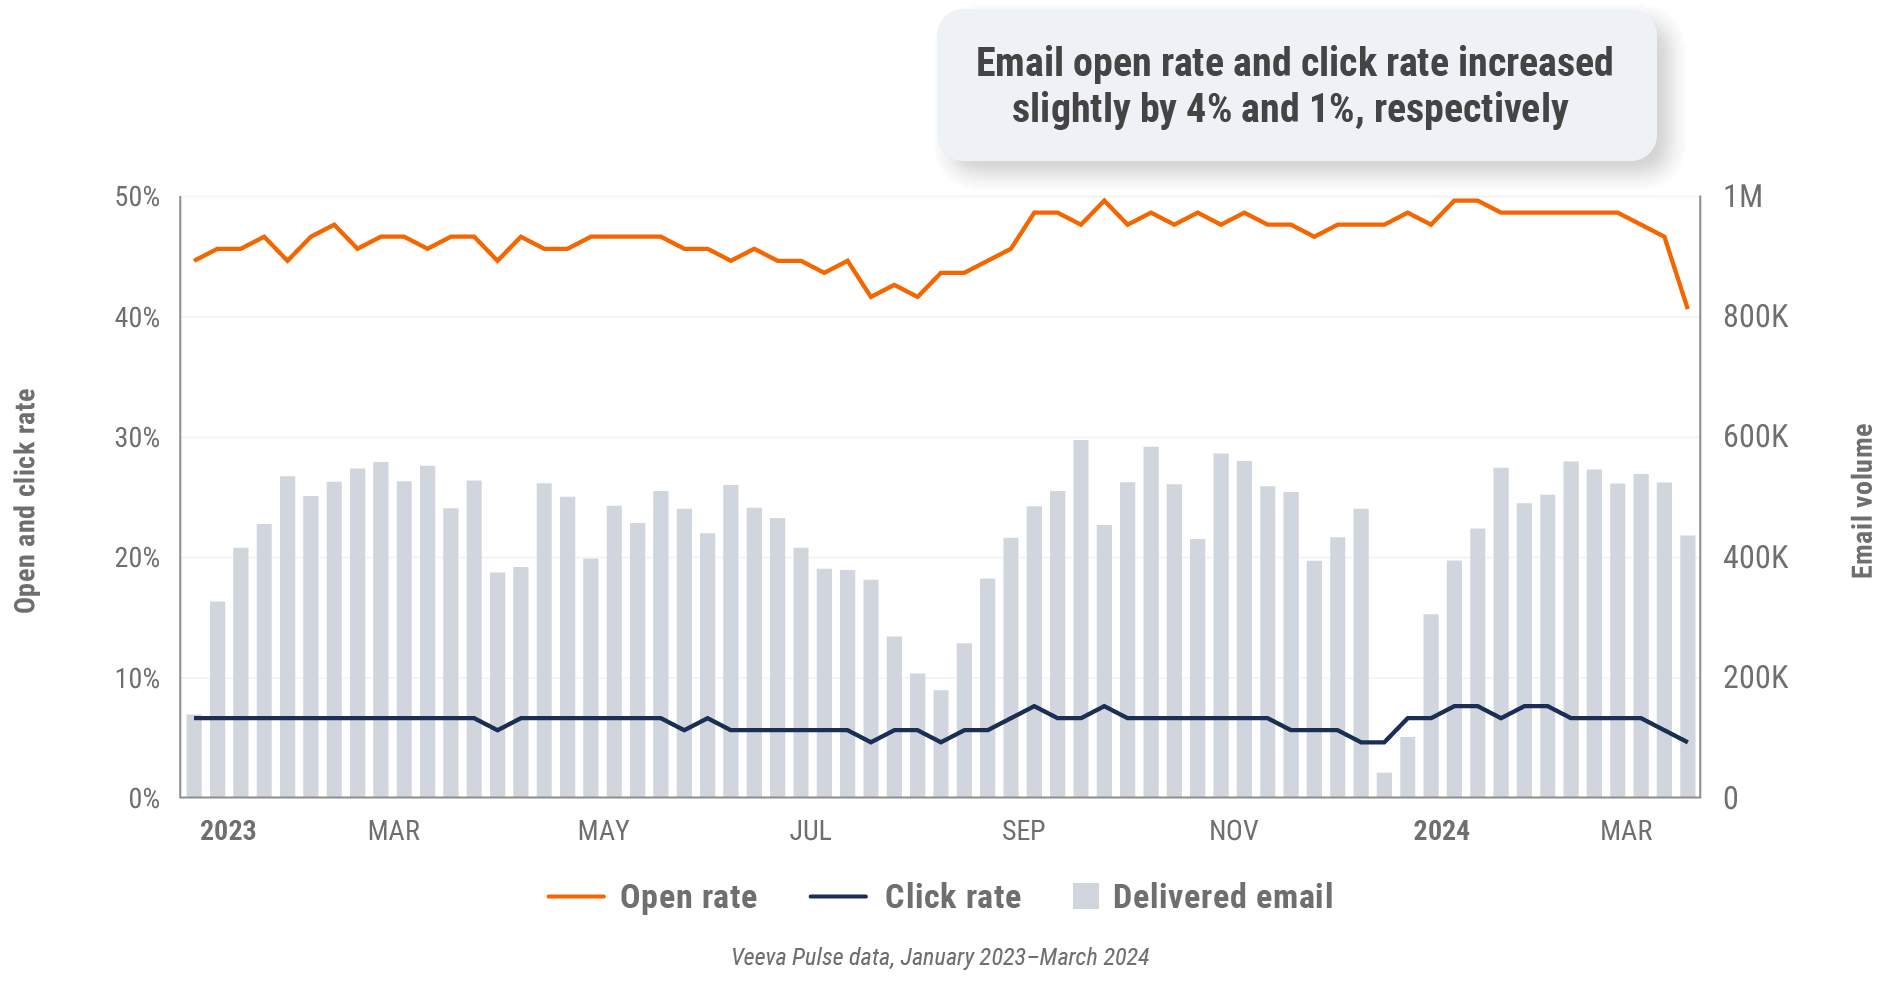
Figure 23: Content usage by channel, Europe
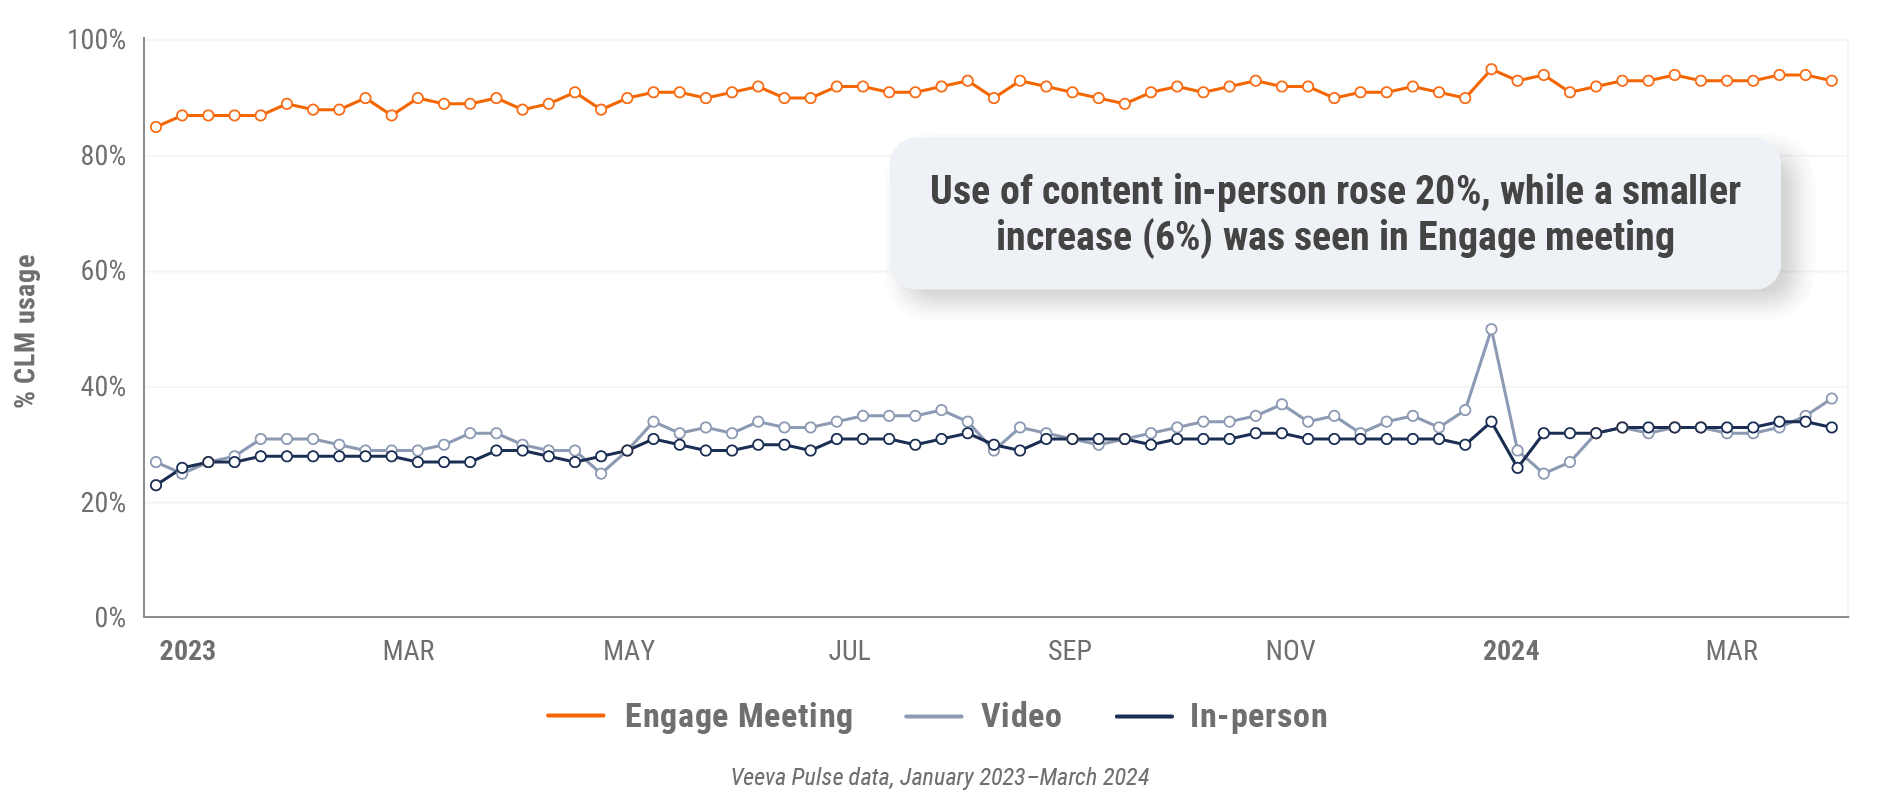
Figure 24: Veeva CRM Engage meeting duration, Europe

Asia market trends
Figure 25: Channel mix evolution, Asia
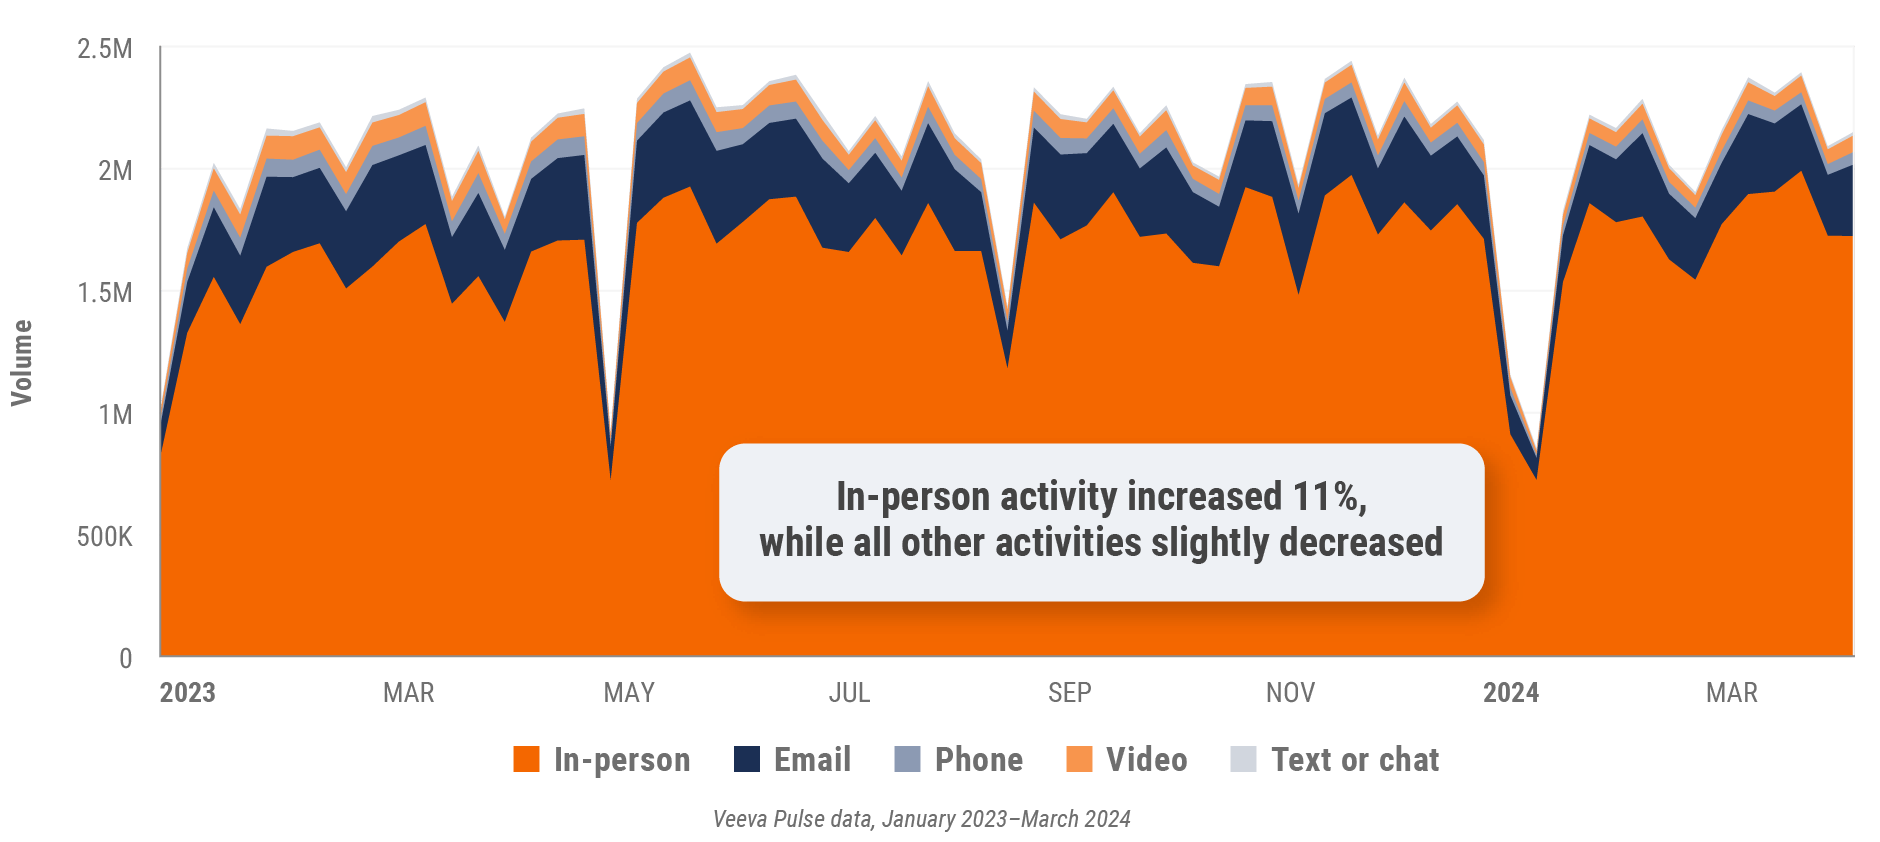
Figure 26: Channel mix, Asia

Asia field team activity Weekly activity per user by engagement channel
Figure 27: Activity by country, Asia
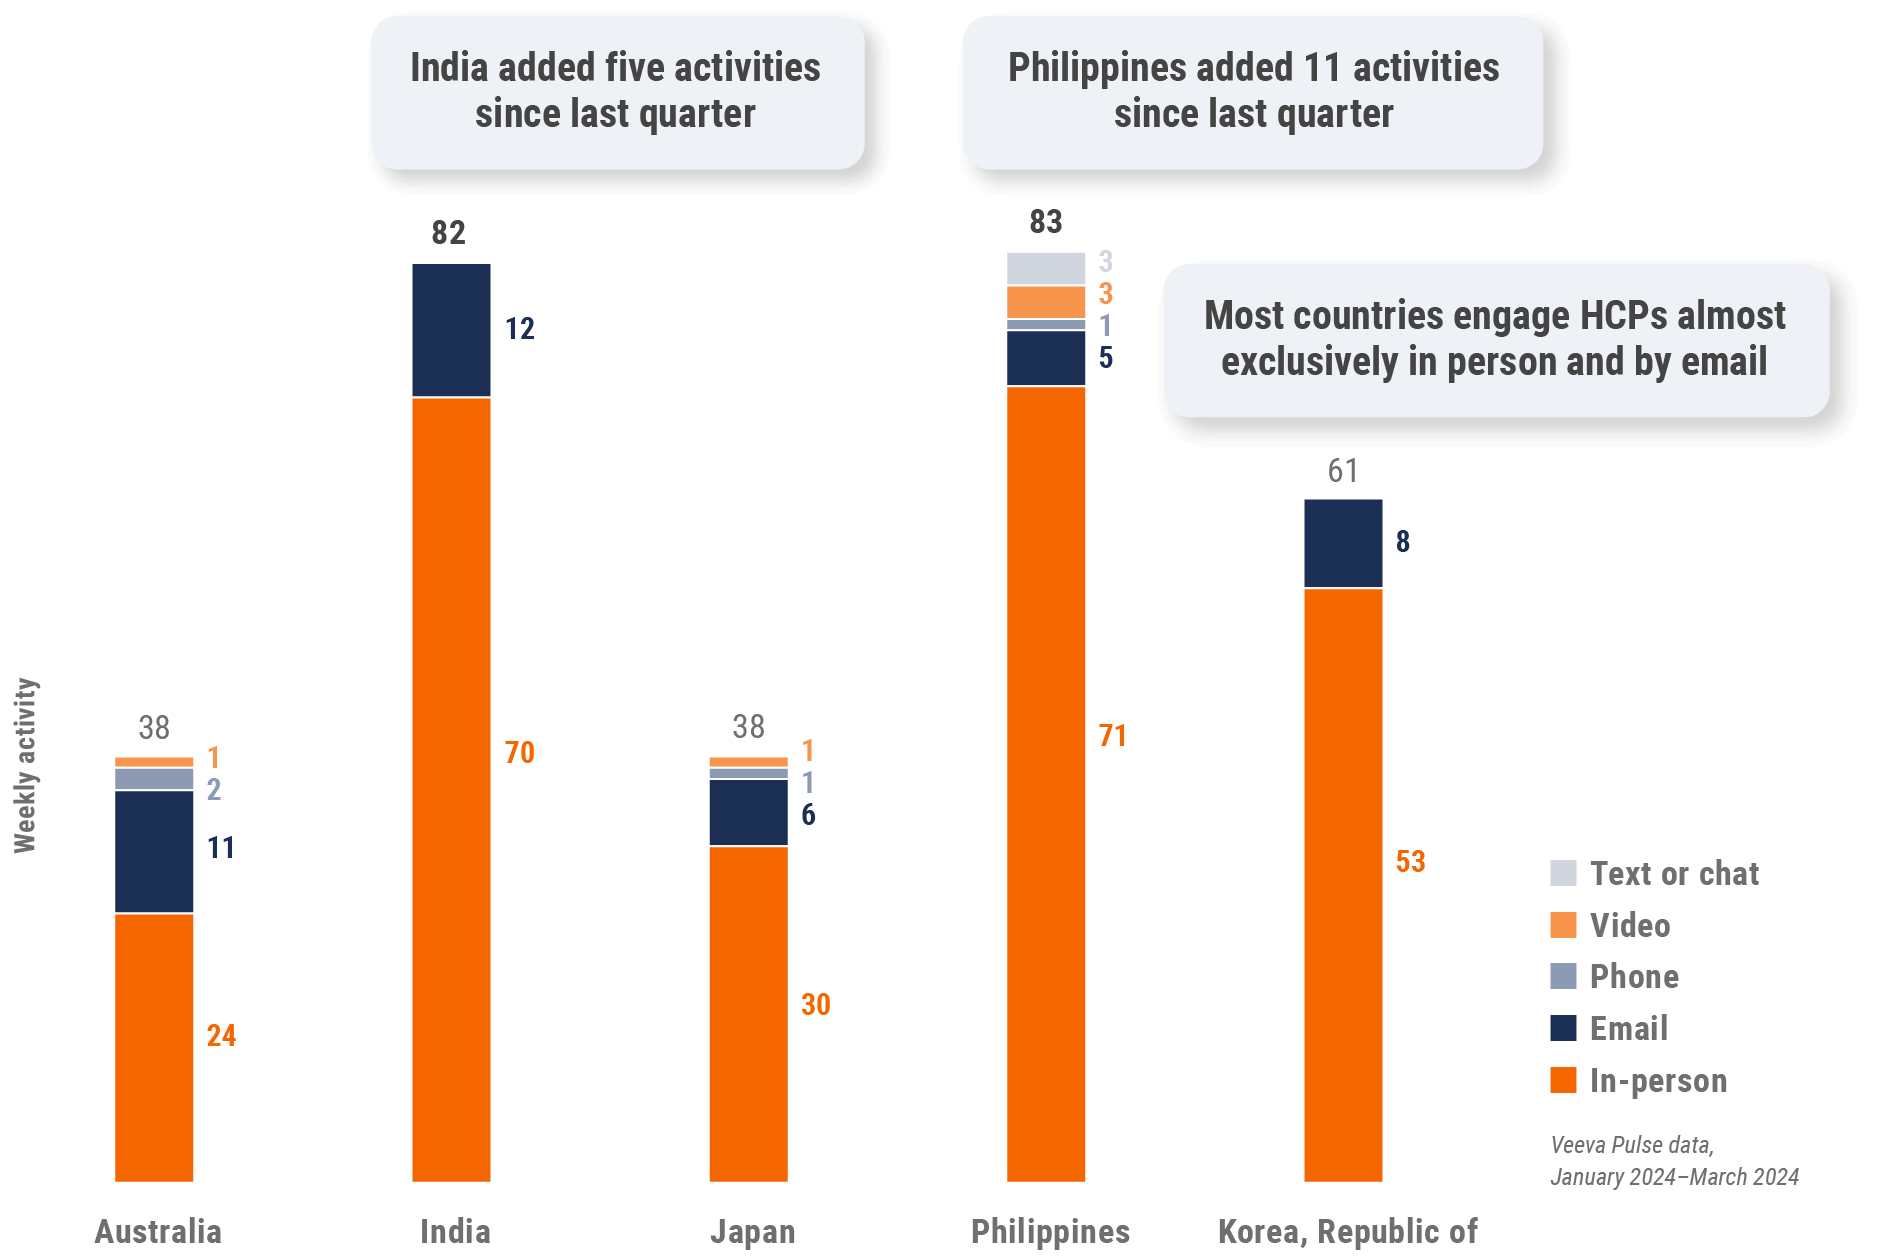
Figure 28: Activity by user type, Asia
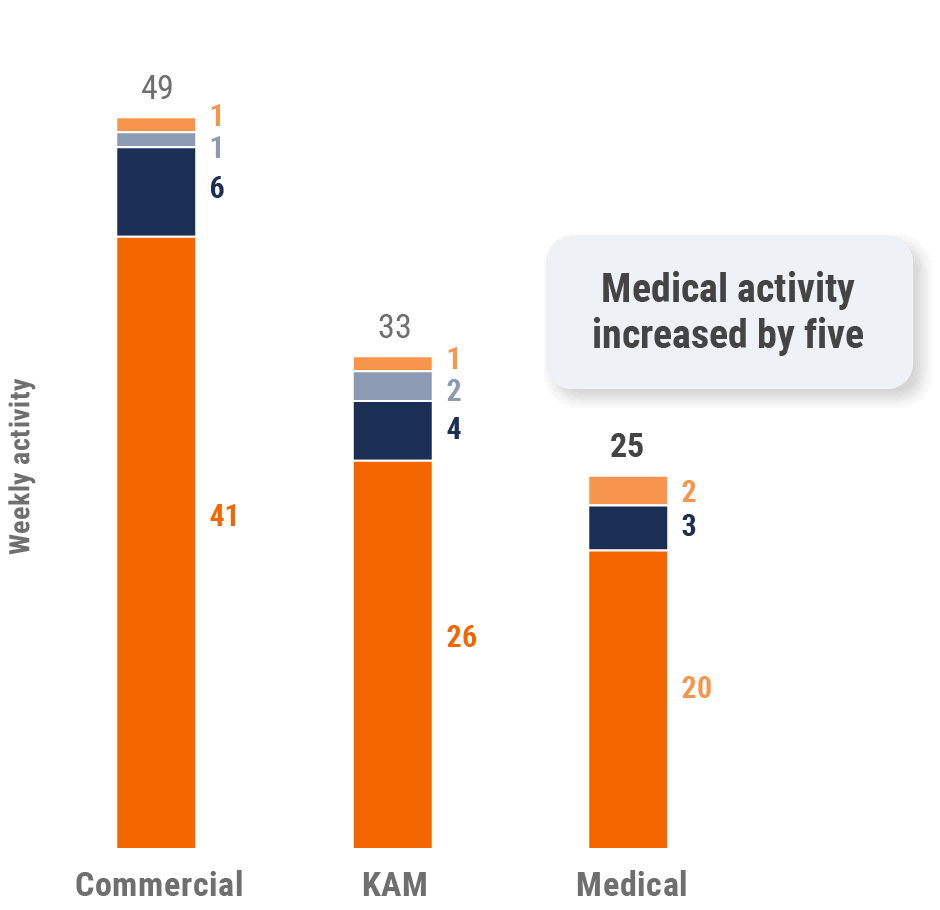
Figure 29: Activity by company size, Asia
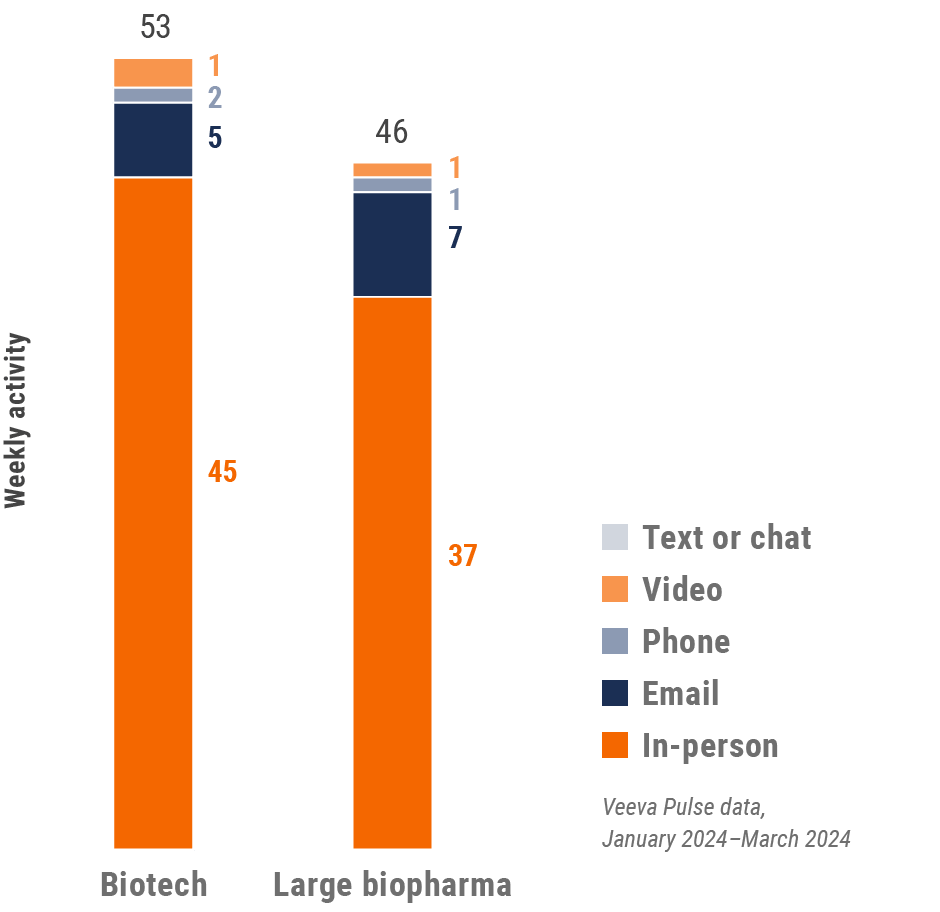
Asia engagement quality Consolidation of key quality metrics
Figure 30: Approved email volume, Asia
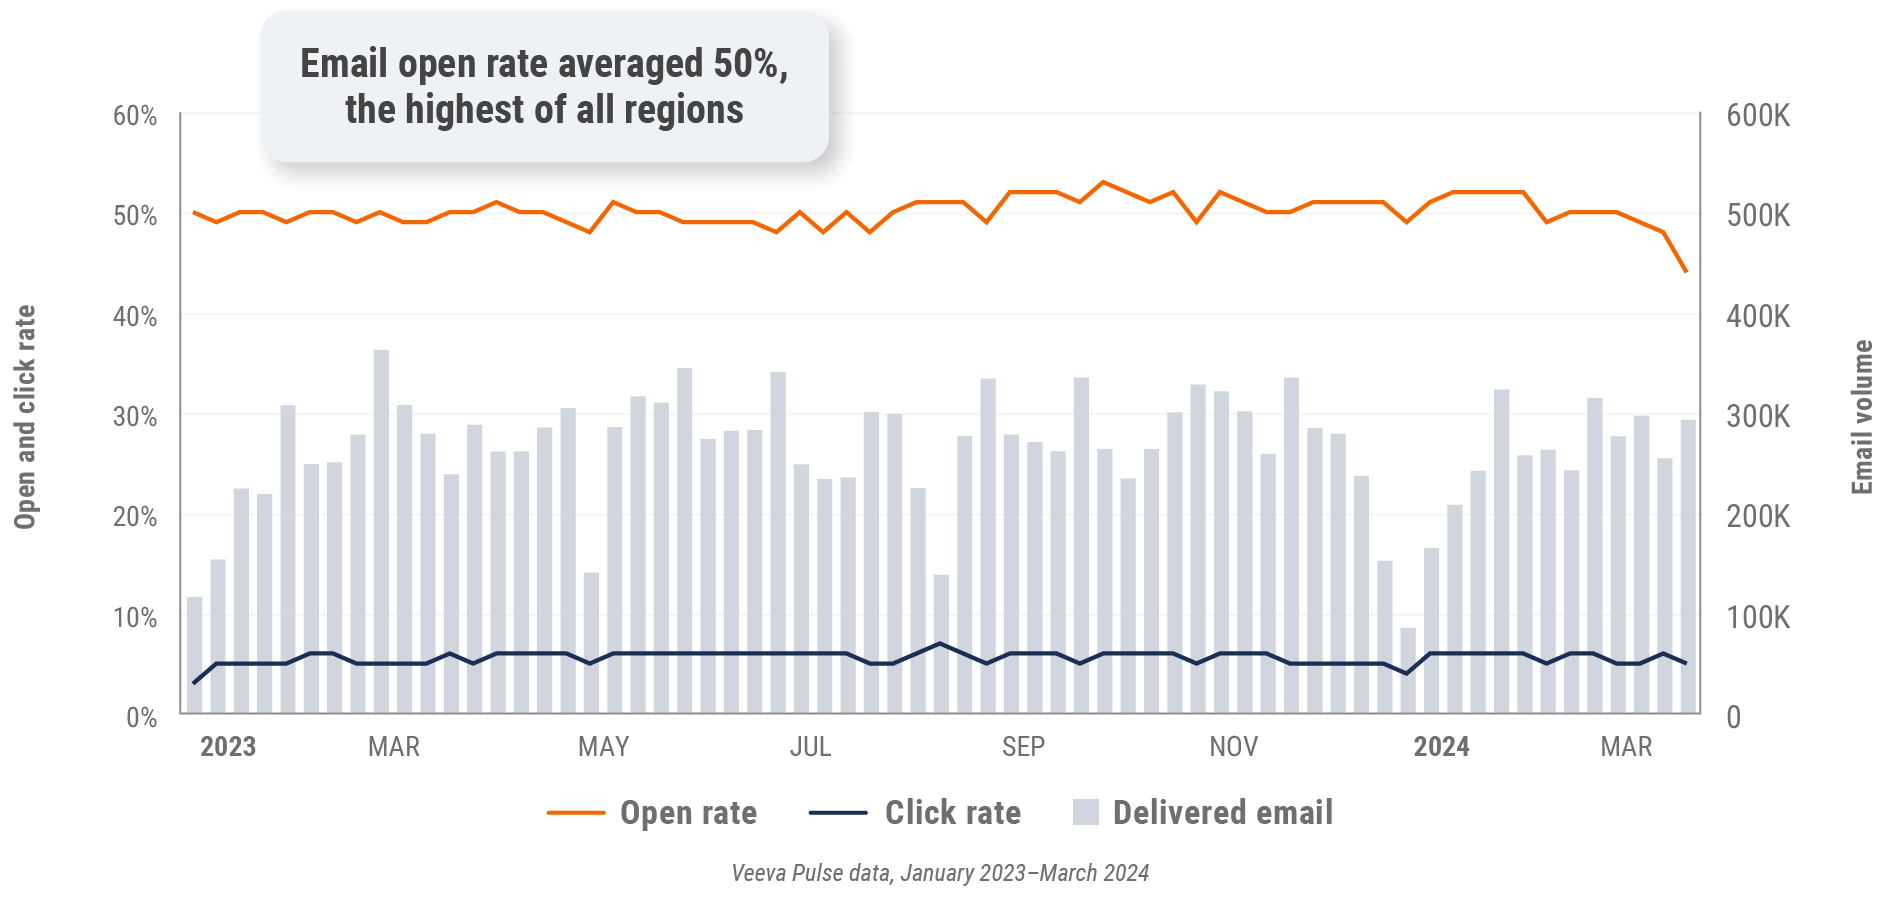
Figure 31: Content usage by channel, Asia
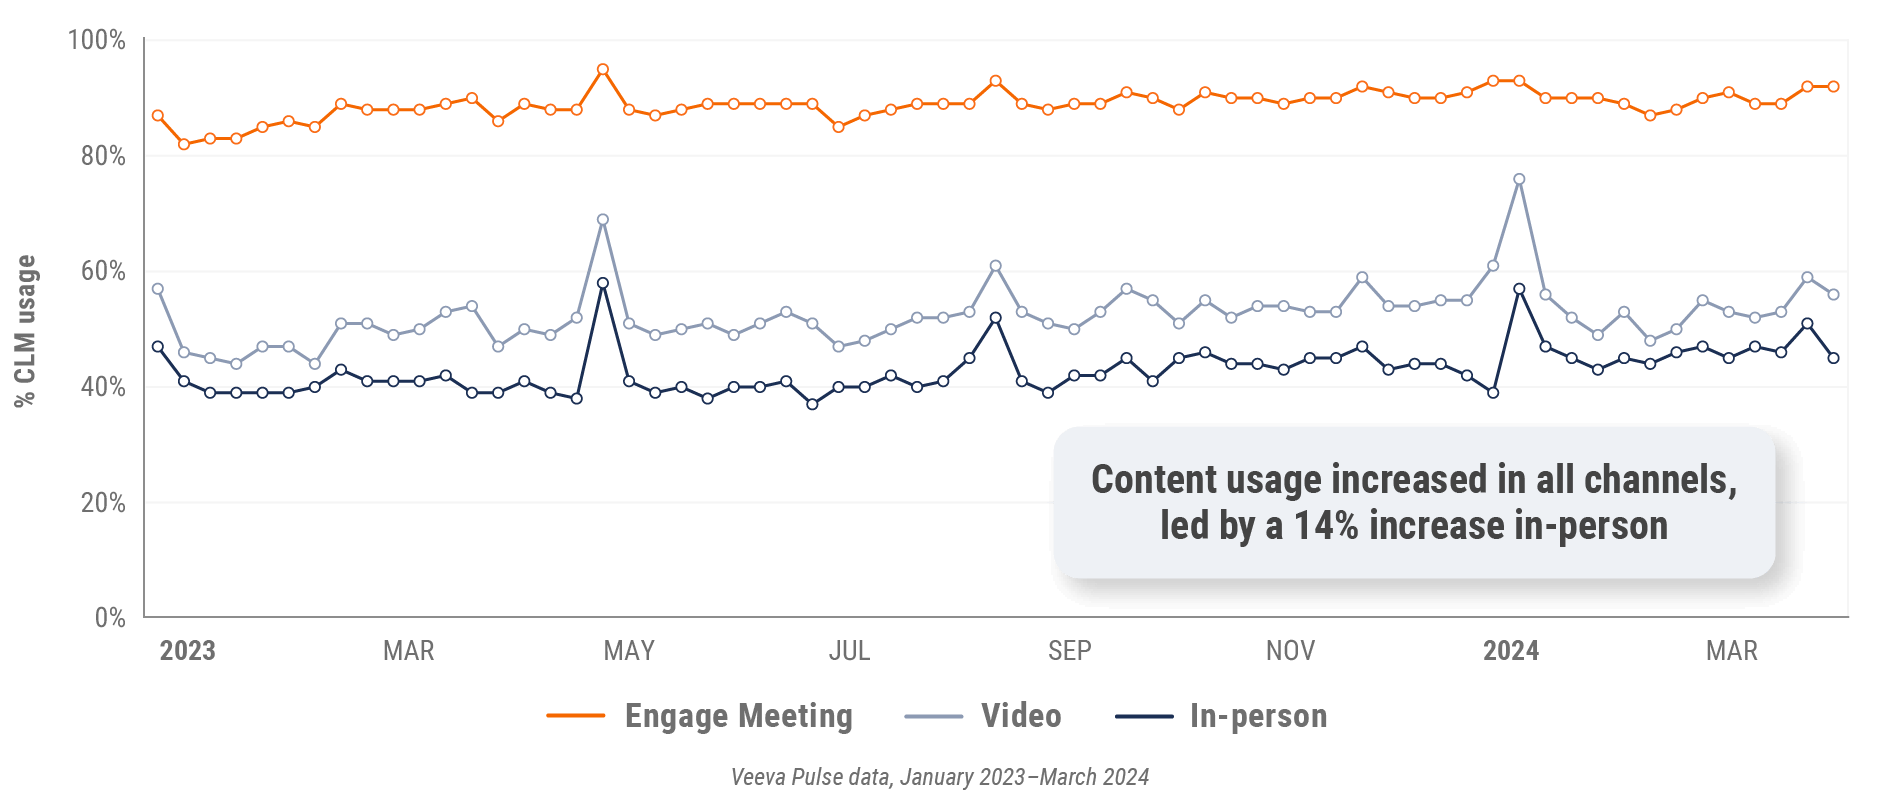
Figure 32: Veeva CRM Engage meeting duration, Asia

Latin America market trends
Figure 33: Channel mix evolution, Latin America
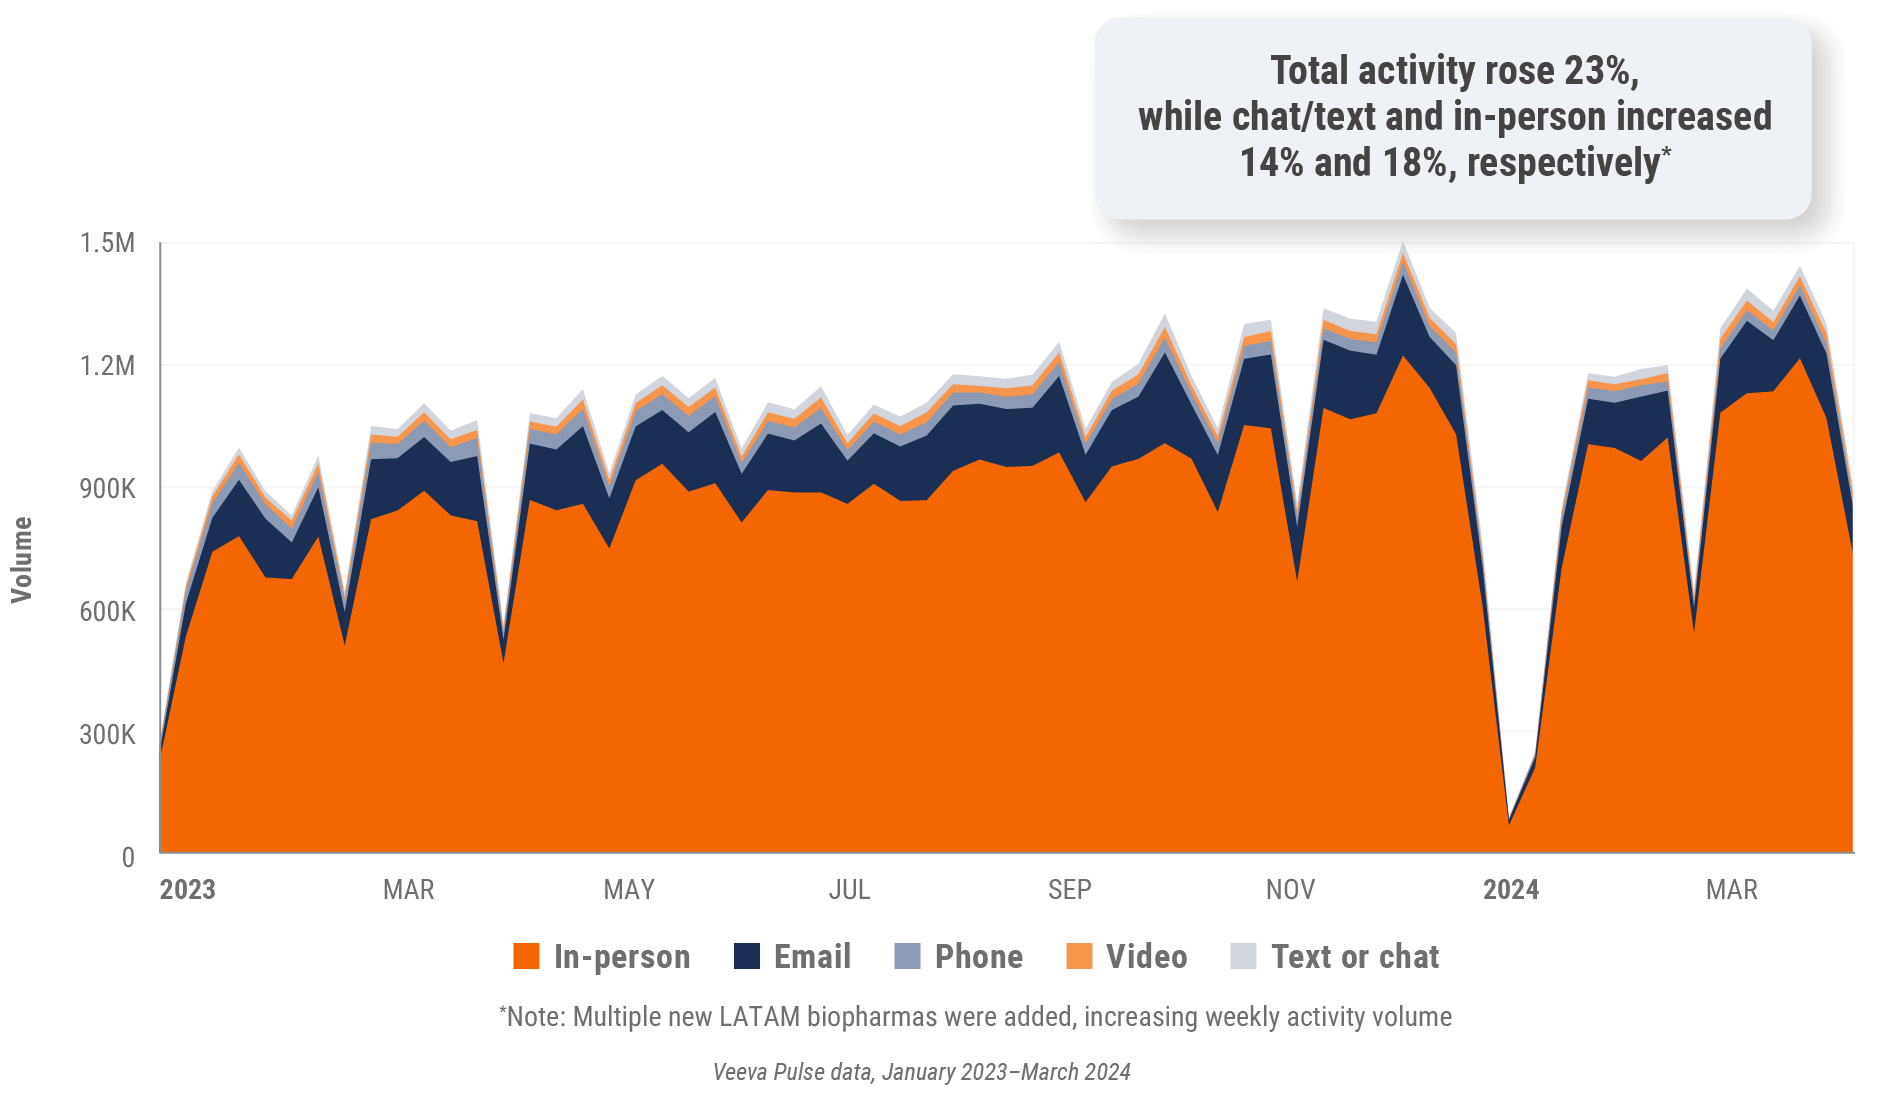
Figure 34: Channel mix, Latin America

Latin America field team activity Weekly activity per user by engagement channel
Figure 35: Activity by country, Latin America
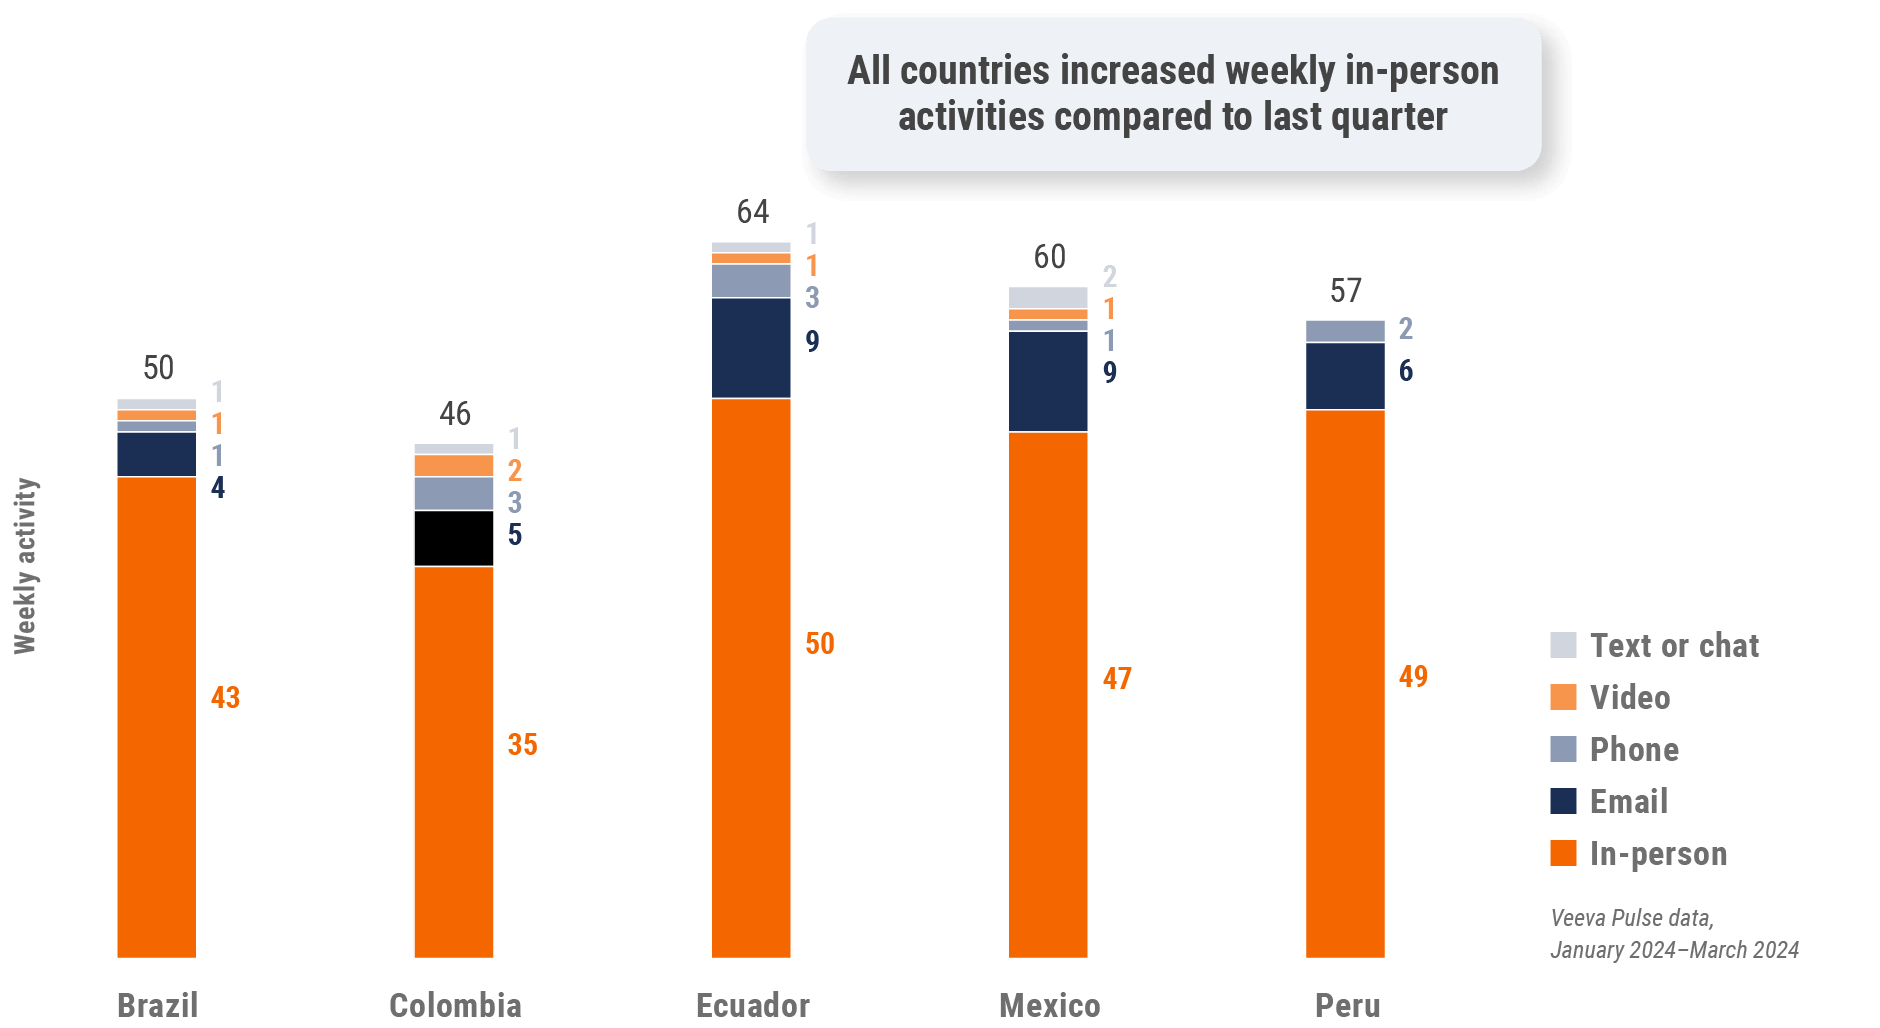
Figure 36: Activity by user type, Latin America
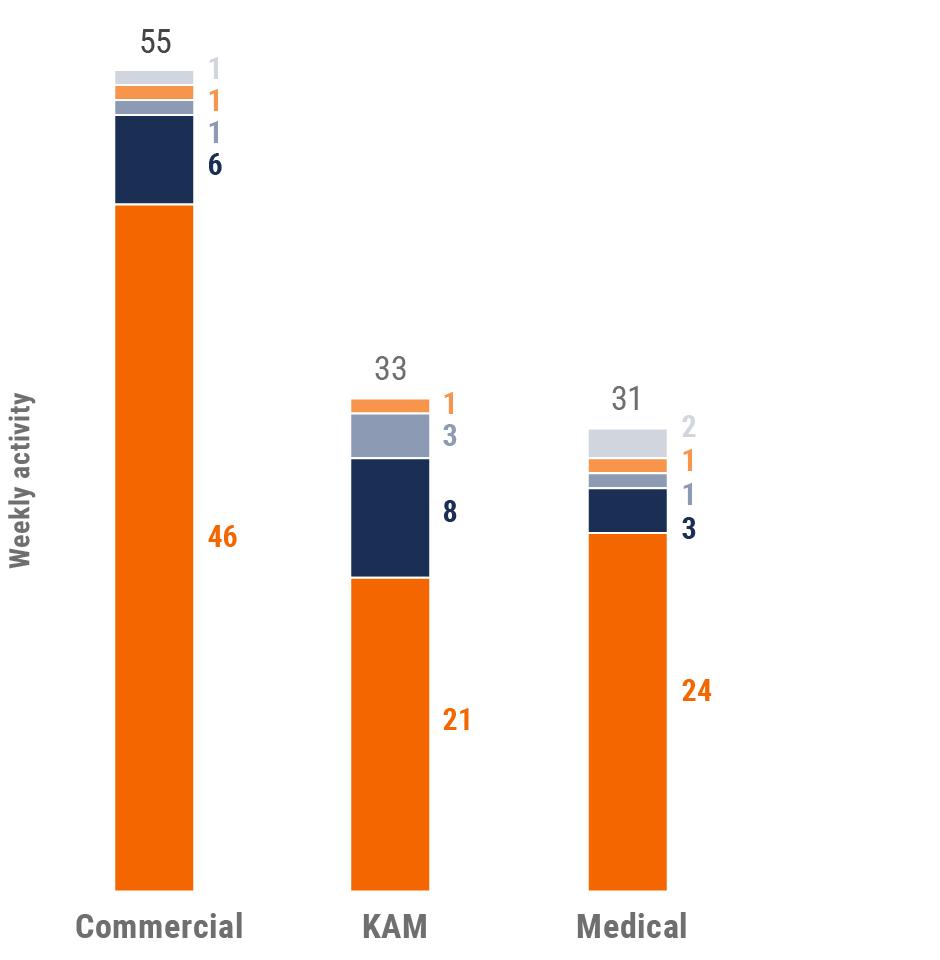
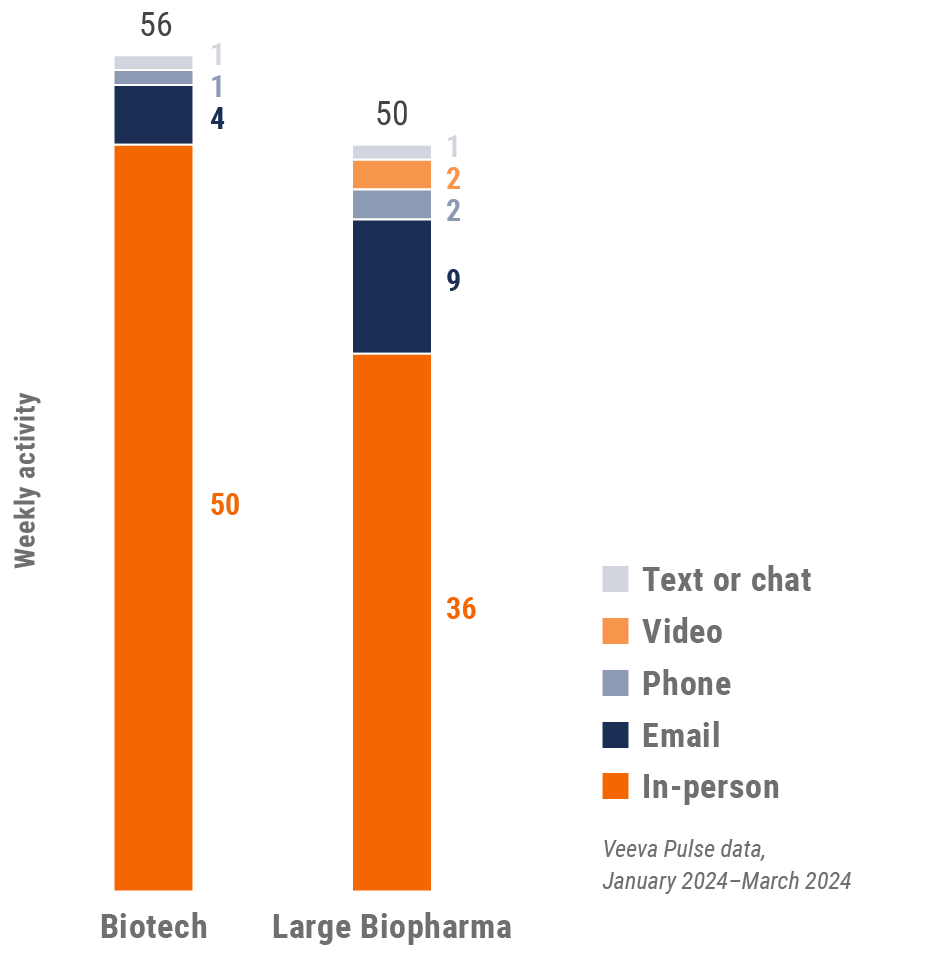
Figure 37: Activity by company size, Latin America
Latin America engagement quality Consolidation of key quality metrics
Figure 38: Approved email volume, Latin America
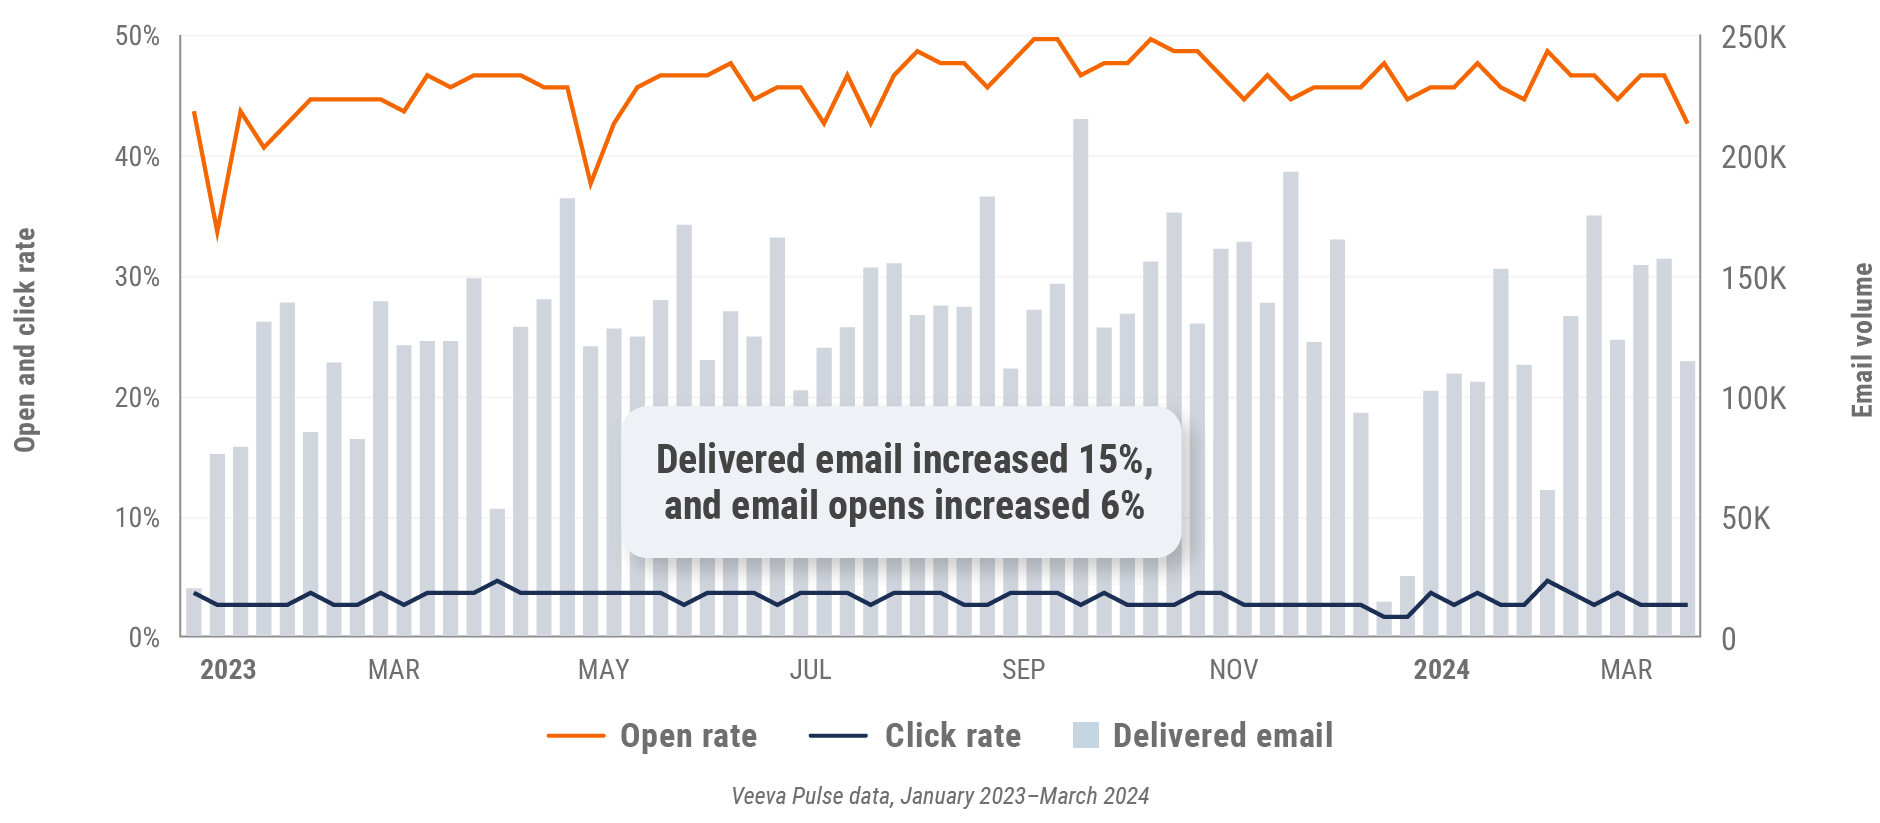
Figure 39: Content usage by channel, Latin America
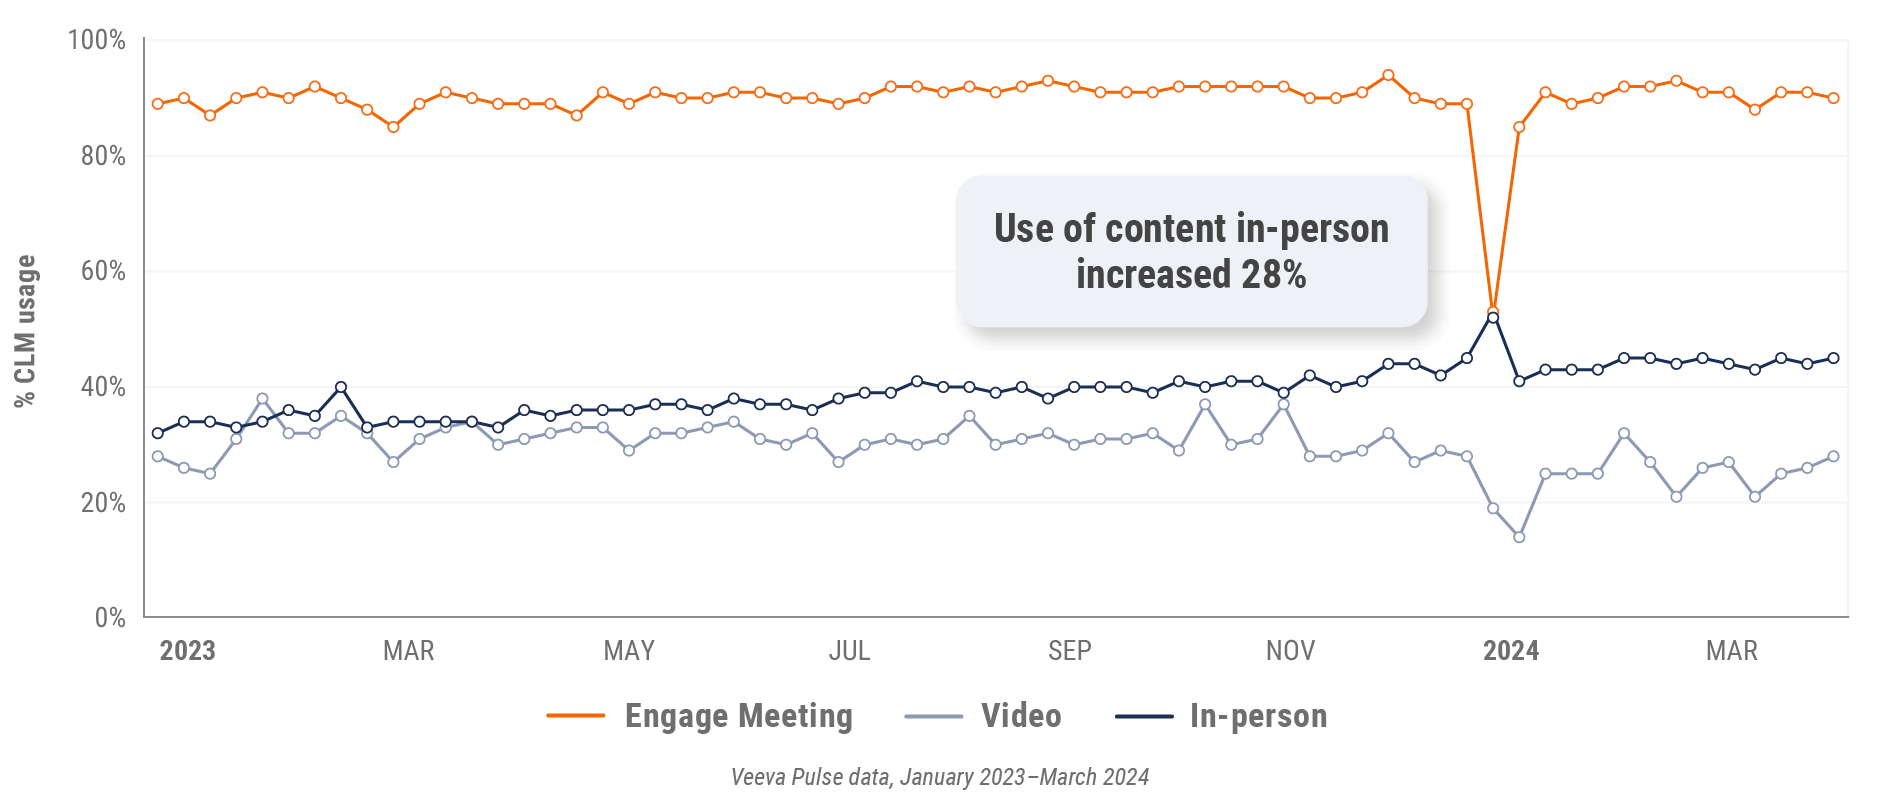
Figure 40: Veeva CRM Engage meeting duration, Latin America

Appendix: Data dictionary
Metric definitions
- Channel mix evolution over time: Weekly Veeva CRM activity volume broken down by the channel of engagement (in-person, phone, video, email, chat, or text)
- Channel mix: Total Veeva CRM activity volume broken down by engagement channel percentage
- Weekly activities per user: The average weekly number of Veeva CRM activities submitted per number of users active in Veeva CRM
- Approved email volume: Volume of approved emails sent via Veeva CRM
- Email open rate: Percentage of approved emails opened at least once out of all approved emails sent via Veeva CRM
- Email click rate: Percentage of approved emails clicked at least once out of all approved emails sent via Veeva CRM
- In-person % CLM usage: Percentage of in-person engagements that leveraged content in Veeva CRM
- Video % CLM usage: Percentage of video engagements that leveraged content in Veeva CRM
- Veeva CRM Engage meeting % CLM usage: Percentage of Veeva CRM Engage meetings that leveraged content in Veeva CRM
- Veeva CRM Engage meeting duration: The average duration of Veeva CRM Engage meetings in minutes
Engagement channel definitions
- In-person: Submitted calls with a CRM Standard Metrics call channel value of ‘in-person’
- Phone: Submitted calls with a CRM Standard Metrics call channel value of ‘phone’
- Video: Veeva CRM Engage calls and video calls via other platforms that are then recorded as calls in Veeva CRM with a Standard Metrics call channel value of ‘video’
- Email: Approved emails and emails sent via other platforms that are then recorded as calls in Veeva CRM with a Standard Metrics call channel value of ‘email’
- Chat or text: Submitted calls with a CRM Standard Metrics call channel value of ‘chat or text’
User type definitions
- Sales: Users that have been classified with the ‘sales’ value in the CRM Standard Metrics user type field
- Key account manager: Users that have been classified with the ‘key account manager’ value in the CRM Standard Metrics user type field
- Medical: Users that have been classified with the ‘medical’ value in the CRM Standard Metrics user type field
- Top global biopharma: Top 17 global biopharma companies by revenue
- Rest of industry: All other biopharmas
Region definitions
- Global: All markets globally
- Europe: Albania, Andorra, Armenia, Aruba, Austria, Azerbaijan, Belarus, Belgium, Bermuda, Bosnia and Herzegovina,
Bulgaria, Croatia, Cyprus, Czech Republic, Denmark, Estonia, Finland, France, French Polynesia, Georgia, Germany,
Greece, Greenland, Guadeloupe, Guernsey, Hungary, Ireland, Italy, Jersey, Latvia, Lithuania, Luxembourg, Macedonia,
Malta, Martinique, Republic of Moldova, Monaco, Montenegro, Netherlands, New Caledonia, Norway, Poland, Portugal,
Romania, Serbia, Slovakia, Slovenia, Spain, Sweden, Switzerland, Ukraine, United Kingdom - Asia: Australia, Bangladesh, Bhutan, Brunei Darussalam, Cambodia, Cocos (Keeling) Islands, Indonesia, Japan,
Kazakhstan, Republic of Korea, Kyrgyzstan, Malaysia, Mongolia, Myanmar, Nauru, Nepal, New Zealand, Philippines,
Samoa, Singapore, Solomon Islands, Sri Lanka, Taiwan, Tajikistan, Thailand, Turkmenistan, Uzbekistan, Vietnam - Latin America: Antigua and Barbuda, Argentina, Bahamas, Barbados, Belize, Bolivia, Brazil, Chile, Colombia, Costa
Rica, Cuba, Dominican Republic, Ecuador, El Salvador, Guatemala, Guyana, Haiti, Honduras, Jamaica, Mexico,
Nicaragua, Panama, Paraguay, Peru, Trinidad and Tobago, Uruguay, Venezuela
Methodology
The Veeva Pulse Field Trends Report is a quarterly industry benchmark for global and regional healthcare professional
(HCP) engagement across the life sciences industry. The report is based on proprietary Veeva Pulse data and insights
from field engagement activities of more than 80% of all industry representatives worldwide (Asia Pacific, Europe, Latin
America, and the United States). Veeva CRM Standard Metrics — now used industrywide — provide the basis for
consistent collection and measurement of engagement KPIs, including channel mix and productivity across regions,
roles, and market segments. The findings are based on:
- Approximately 600 million annual global field activities captured in Veeva CRM and Veeva CRM Engage
- 80 billion prescription (Rx) and medical (Mx) records captured in Veeva Compass Patient, U.S.-specific
anonymous patient longitudinal data that includes prescriptions, procedures, and diagnoses - 3+ million profiles containing publications, clinical trials, conferences, associations, guidelines, grants,
payments, social media, news mentions, and influence on community practice from Veeva Link Key People across 85+ countries and 24 therapeutic areas - Global reference data of healthcare professionals, healthcare organizations, and affiliations from OpenData Commercial, containing addresses, emails, specialties, demographics, and compliance data (license
information and industry identifiers) available in 100+ countries today and 115+ countries by the end of 2024
The Veeva Pulse Field Trends Report delivers insights that inform the industry and help field teams align their strategy to key
market trends for improved commercial success. The global Veeva Business Consulting team also helps customers inform
their strategies using industry benchmarking with Veeva Pulse data.
*All trending chart insights (except Figure 7) are calculated using an average weekly percent change during the specified time period.
