Article
Finding New Prescribers to Improve Territory Alignments
Imagine you are launching a new injectable extended-release product to treat schizophrenia. You need to find relevant HCPs, and optimize territory alignments and field team sizing. There are 13 oral and injectable products available today, and you need a clear picture of current market and HCP activity.
What data do you turn to?
Complex therapies have HCP-level data and visibility gaps
With complex therapies like those for schizophrenia where patients may receive therapy in office and at home, you need a central source of truth – an accurate view of a brand’s total transactions (total prescriptions and procedures). But for decades this hasn’t existed. Instead, biopharmas have had to:
- Piece together views of the market with traditional retail sources that lack detail on medically administered therapies
- Rely on their field teams to learn who is prescribing a given therapy versus directing them on the next best action
The downstream implications are significant. Without a complete view, biopharmas:
- Are not reaching all eligible patients and relevant prescribers
- Are missing out on high volume HCPs, including a meaningful amount in the top decile
This negatively impacts potential commercial success, creating challenges across HCP targeting, resource optimization, territory alignments, field team sizing, and overall commercial execution.
Modern prescriber-level data informs more opportunities
Modern projected data products, like Veeva Compass Prescriber, give more complete visibility by capturing all HCP-level activity across prescriptions and procedures for retail and non-retail products.
To understand how a more complete picture of HCP activity improves a brand’s ability to find relevant HCPs, and optimize territory alignments and field team sizing, we applied data from Compass Prescriber to the launch scenario in the schizophrenia market.
For this example, we analyzed 13 real products with data from Compass Prescriber, including all oral and injectables, each indicated for schizophrenia. We included all prescribers (regardless of volume) and data from January through December 2023. We accounted for total prescriptions, as well as total procedures (including medical administrations like injections, infusions, and in-office administered therapies).
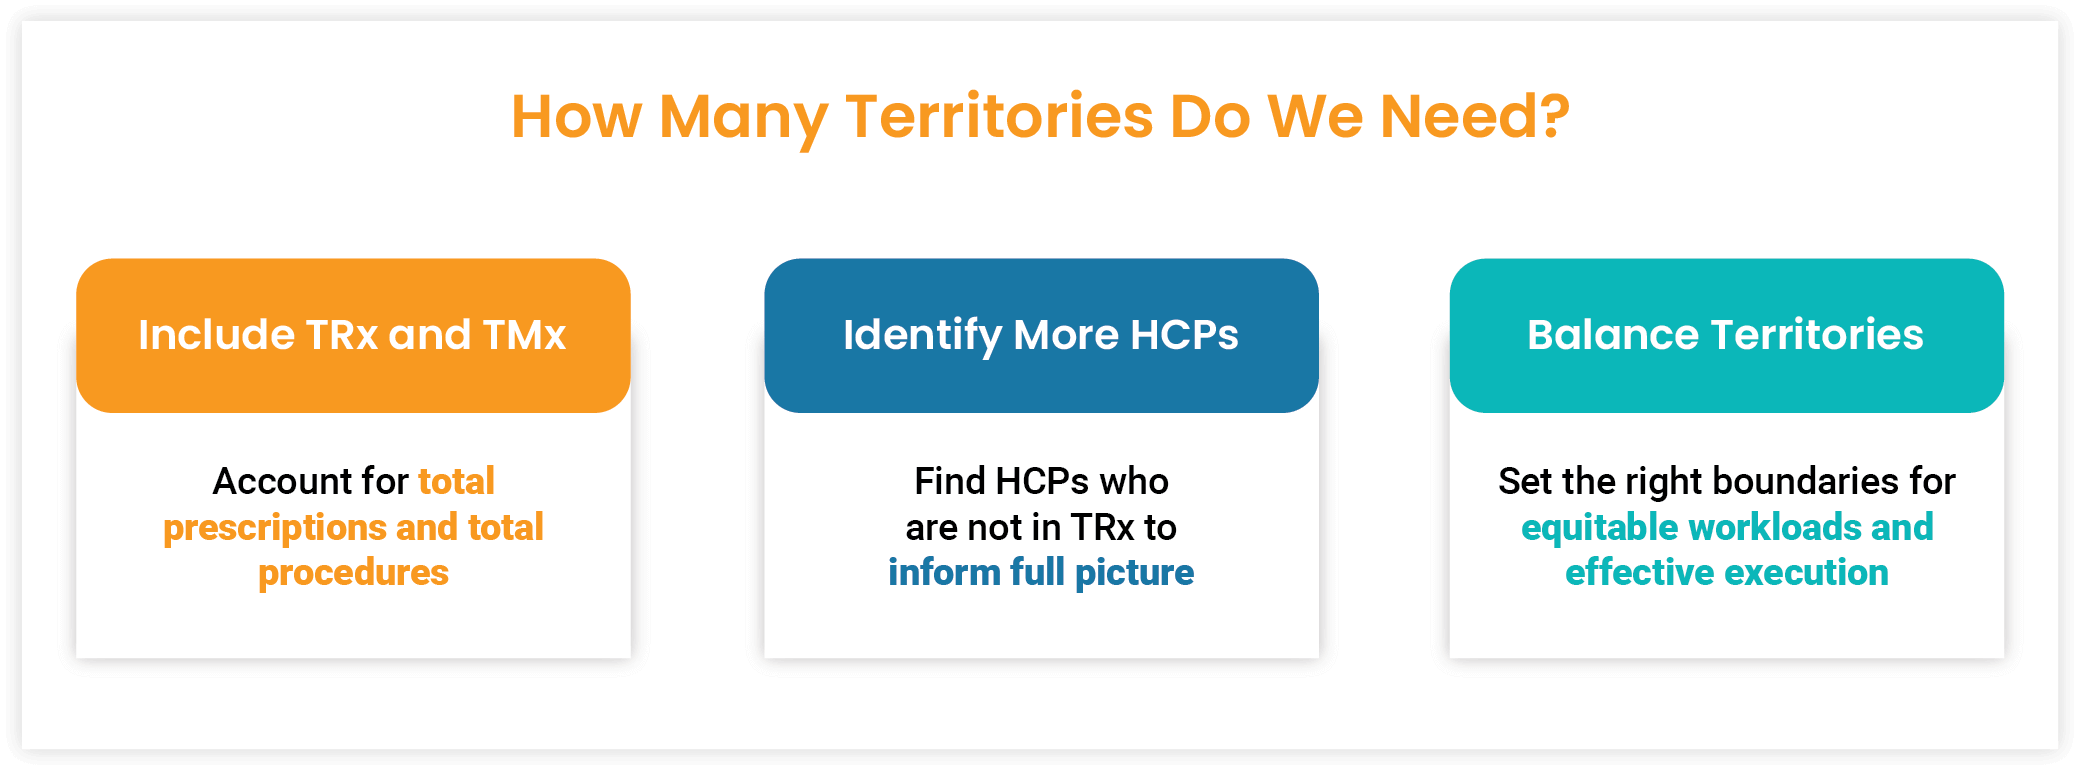
To determine the number of necessary territories, we compared the territories of competitive products. Before data analysis, our hypothesis was to enter the market with a 240-person team.
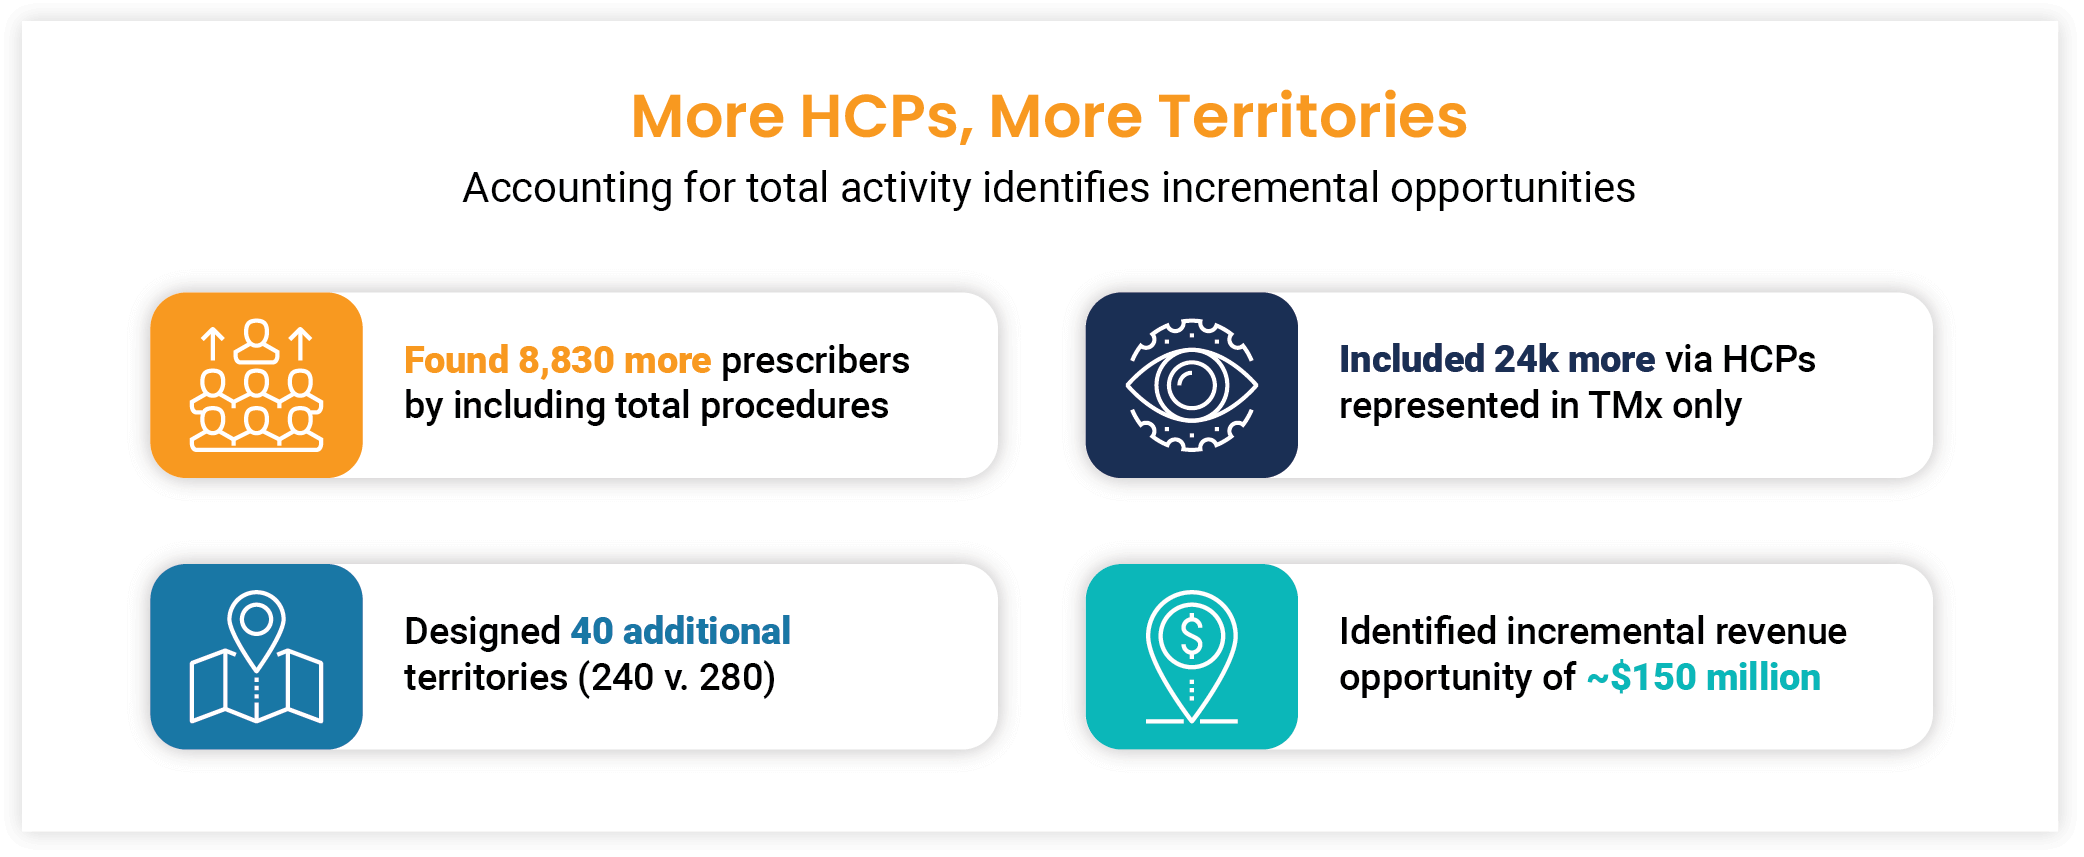
Our analysis identified more HCPs, equating to more territories. The results included:
- 8,830 more prescribers by including total prescriptions and procedures (Tx). These HCPs had no records in total prescriptions (TRx).
- 24,400 more patients via net new HCPs.
- 40 additional designed territories (240 vs. 280).
- Identification of approximately $150 million in incremental revenue opportunity.
- Optimized HCP rankings. For example, in our analysis, the No. 3 ranked HCP for total prescriptions and procedures (Tx) dropped to No. 86 when looking at total prescriptions (TRx) only.
Better projected data accelerates diagnosis and treatment
Modern data alternatives like Compass Prescriber give more visibility into the market, patients, and HCPs. It helps right-size territory alignments, improve targeting, and drive precision with commercial planning and execution. Most importantly, it helps quickly identify and reach the true priority HCPs who are seeing and treating patients who need these innovative medicines.
To learn more, watch this on-demand demo of how to use Veeva Compass to find more patients and HCPs, optimize territory alignments, and then activate the field on new insights.