Industry Report
Veeva Pulse Field Trends Report
Closing the Gap: New Science, New HCP Expectations
Innovation in the R&D pipeline is putting new pressure on old commercial engagement models. Increasing therapeutic complexity and competition, narrowing windows for launch success, and HCPs’ growing need for deep scientific information require a coordinated commercial strategy to efficiently educate HCPs on new treatments.
But sales and marketing teams, in functional silos, continue to lean on engagement models built for medicines of the past. Ironically, investments in technology and data have compounded the problem. Layers of disconnected systems and disparate data have limited collaboration, resulting in a disjointed customer experience and slowing down the path to treatment adoption.
Agile biopharmas willing to disrupt legacy silos in service of the customer are changing this dynamic. Empowered with connected tools and data, sales and marketing teams are coordinating a customer experience that meets HCPs’ needs quickly and drives treatment adoption.
“Physicians have limited time and don’t need repetitive information. The transfer must be efficient, with scientifically trusted information through the right channel. Every interaction should inform the next communication.”
— Dr. Vital Hevia, urologist and robotic surgeon, ROC Clinic and HM Hospitals

Dan Rizzo
VP, Global Head of Business Consulting

Disconnected models don’t meet evolving HCP needs
Therapeutic complexity continues to rise, and the volume of medical knowledge doubles every 73 days, according to some estimates. At the same time, it’s also harder to reach HCPs via traditional methods. They are highly selective, and even for biopharmas with access, in-person meetings per HCP are down 7% since last year.
But biopharmas struggle to close the gap between HCPs’ needs and their decreasing share of time and attention. Sales and marketing teams often use disconnected tech, purchase different data sets, and track different KPIs. In many cases, they have a different understanding of target HCPs and what success looks like.
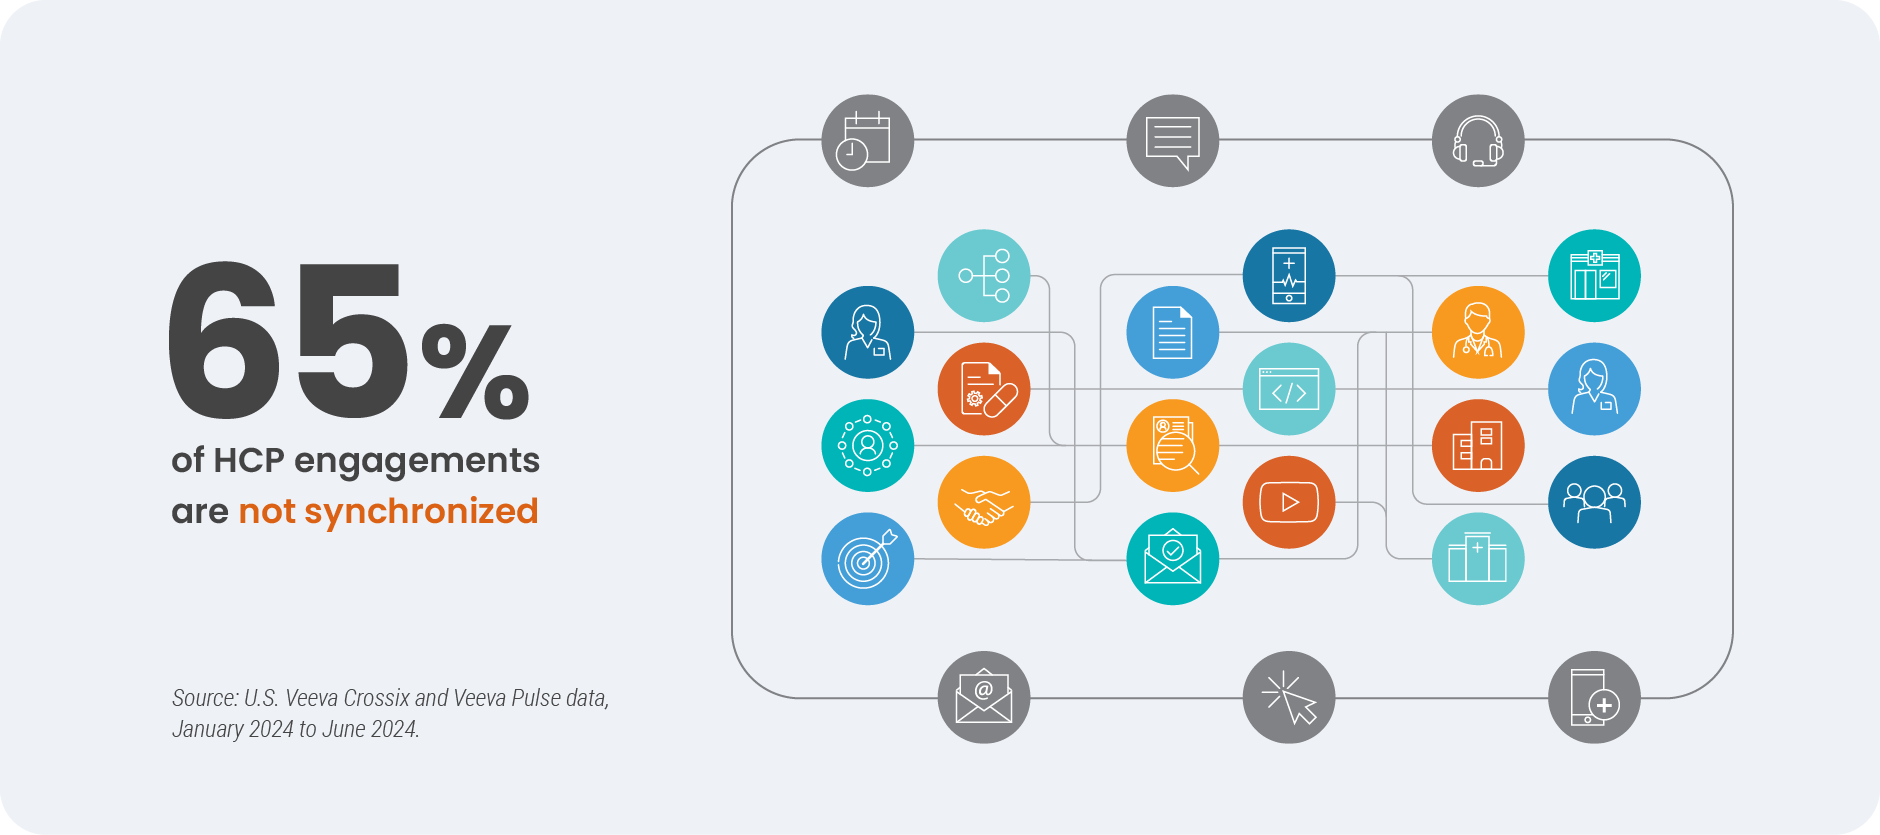
As a result, 65% of HCP engagements are not synchronized, despite the proven effectiveness.
Connected sales and marketing improves outcomes
In the past, sales and marketing teams tried to boost HCP engagement by each turning up the dial on their own strategies, optimizing within the function. But in this complex environment, simply adding more interactions isn’t effective or practical. Instead, data shows that a connected, coordinated omnichannel strategy blending in-person and promotional touchpoints drives results.
This approach results in:
- More efficient outcomes for the brand
- A better customer experience for the HCP
- Improved treatment adoption for the patient
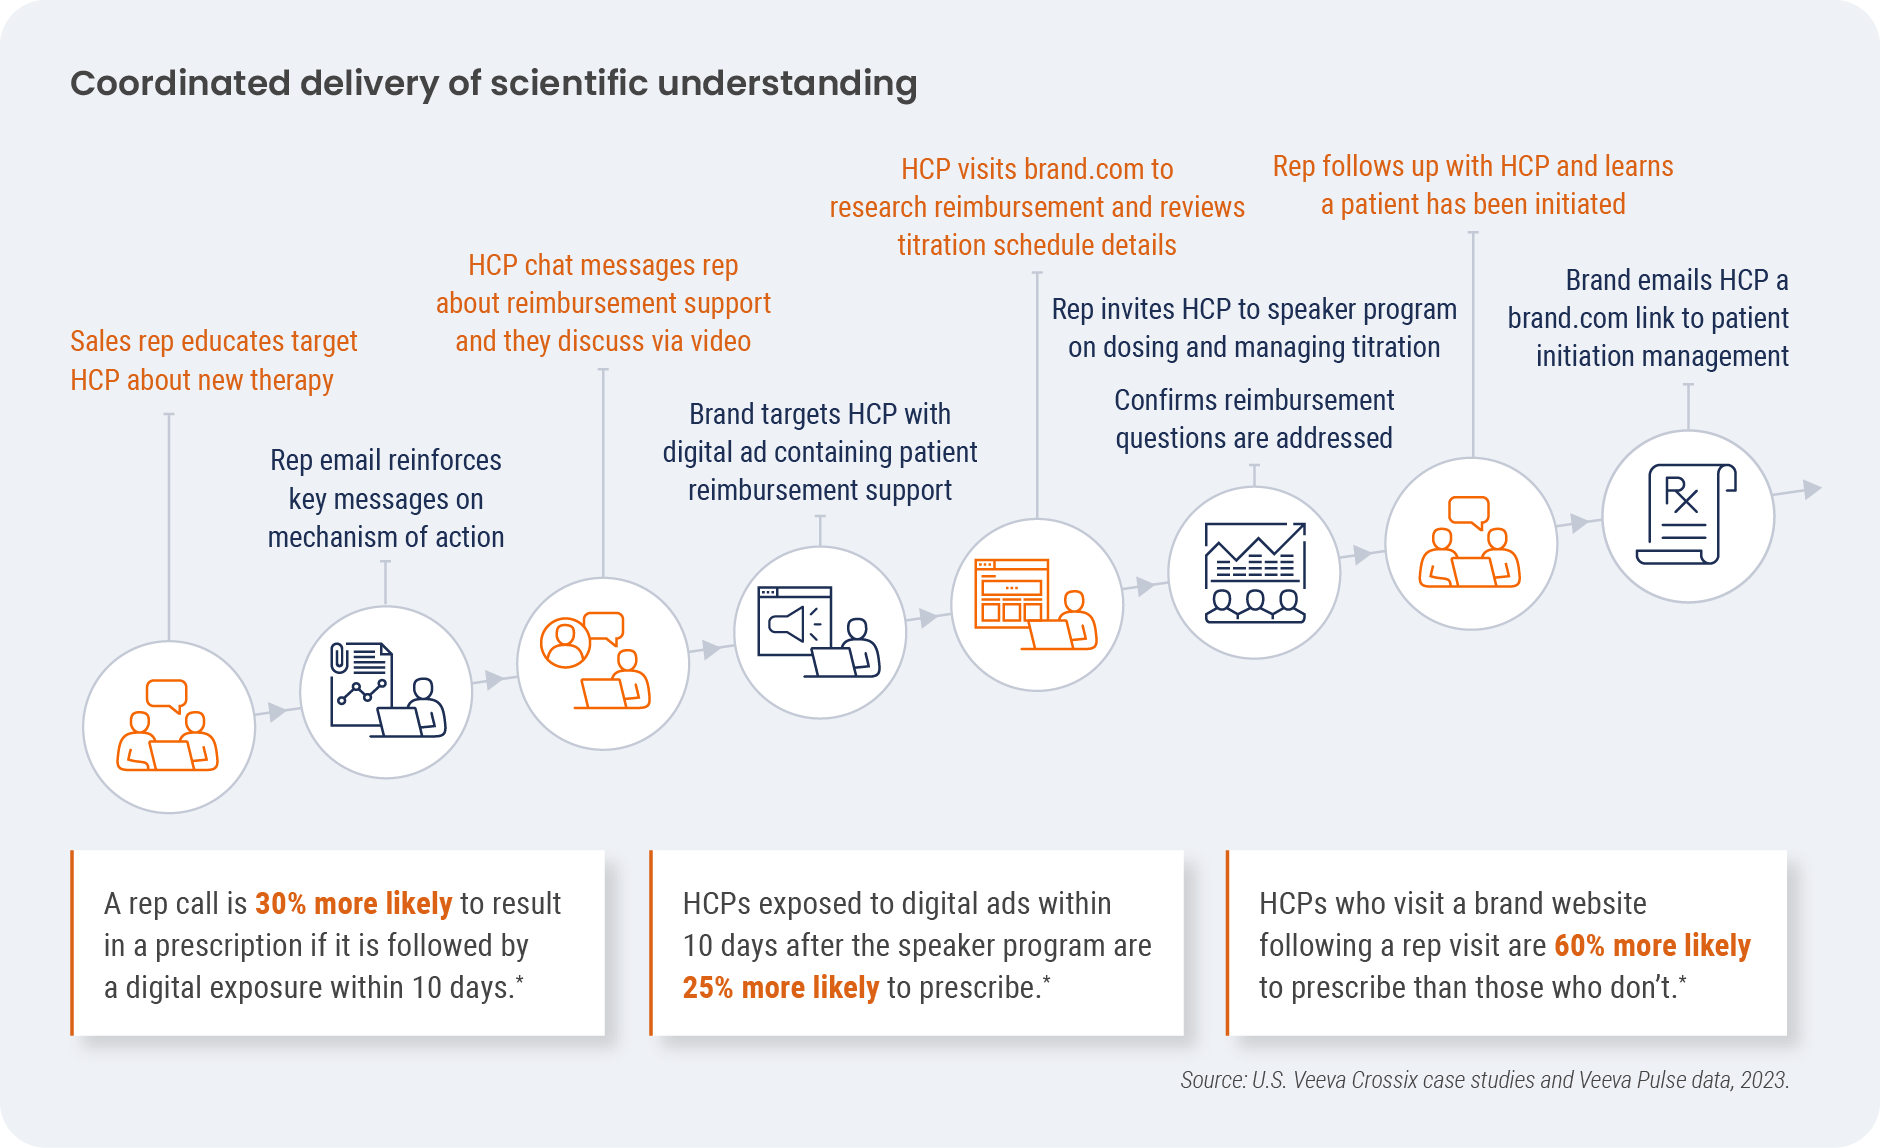
The figure below illustrates key customer touchpoints where coordinated, timely action between sales and marketing increases scientific understanding.
Early movers are disrupting old engagement models
Innovations in technology and data are removing the traditional barriers to connected and coordinated engagement. Early movers are coordinating sales and marketing and building agility into their commercial model to deliver on the needs of HCPs.
This emerging sales and marketing model will include:

While the fundamental capabilities may be similar, organizations will come to this model differently:
- Smaller, scrappier biotechs will make these investments out of necessity to compete with larger, better-resourced companies.
- Large global biopharmas will confront disconnected engagement models and functional silos to create a competitive advantage and differentiate on customer experience.
Companies that bring sales and marketing together with medical and service teams will be best positioned to meet HCPs’ growing scientific needs and increasing expectations.
Reach out to Veeva Business Consulting to learn how connected sales and marketing deliver a better customer experience.
Global and Regional Trends
This report highlights global and regional field engagement trends from Veeva Pulse data gathered between July 2023 and September 2024. Veeva Pulse data is sourced from Veeva’s aggregated CRM activity, including field engagement stats from all instances of Veeva CRM globally. In this report, all comparisons are year-over-year, Q3 2023 to Q3 2024, unless otherwise noted.
Global trends*
Figure 1: Channel mix evolution, global
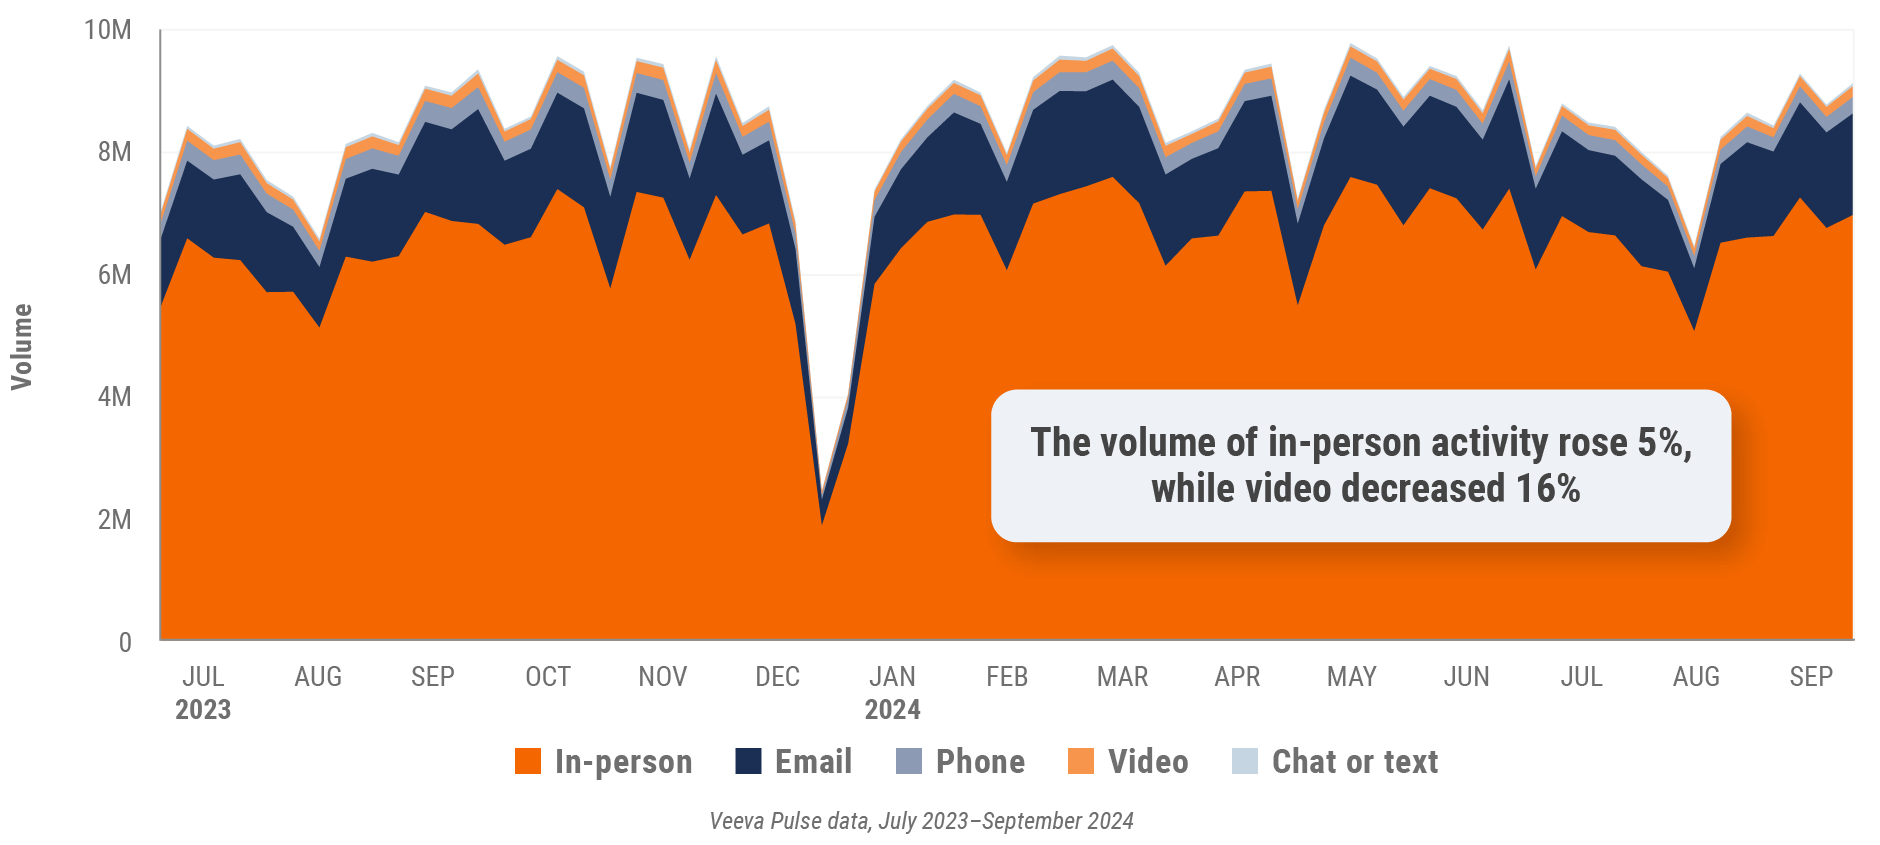
Figure 2: Channel mix, global

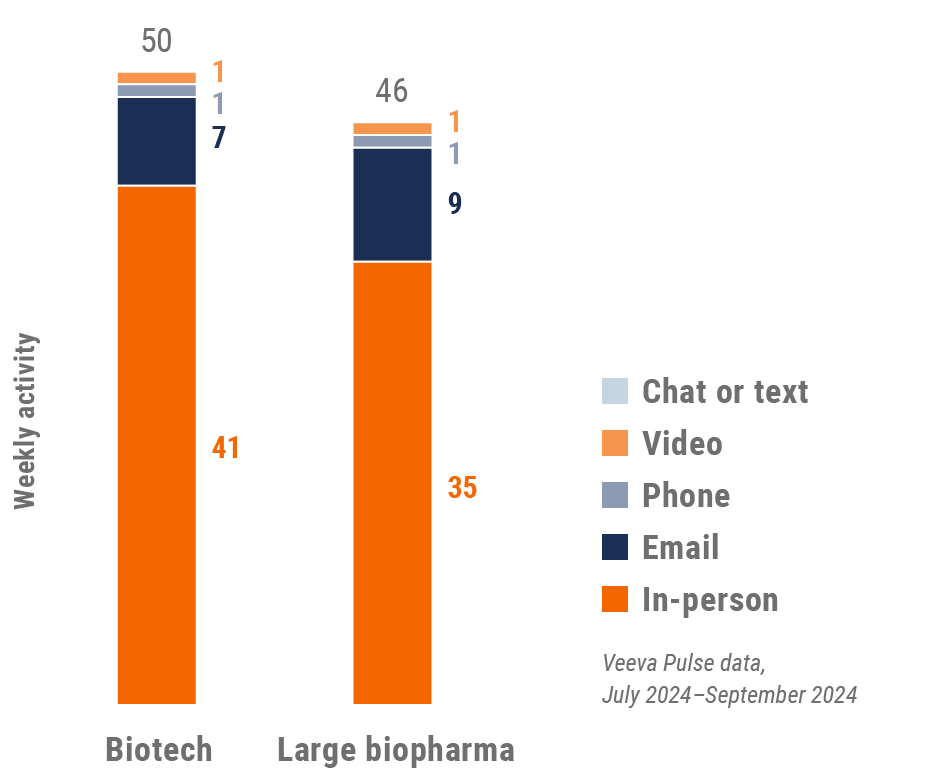
Global field team activity Weekly activity per user by engagement channel
Figure 3: Activity by region, global
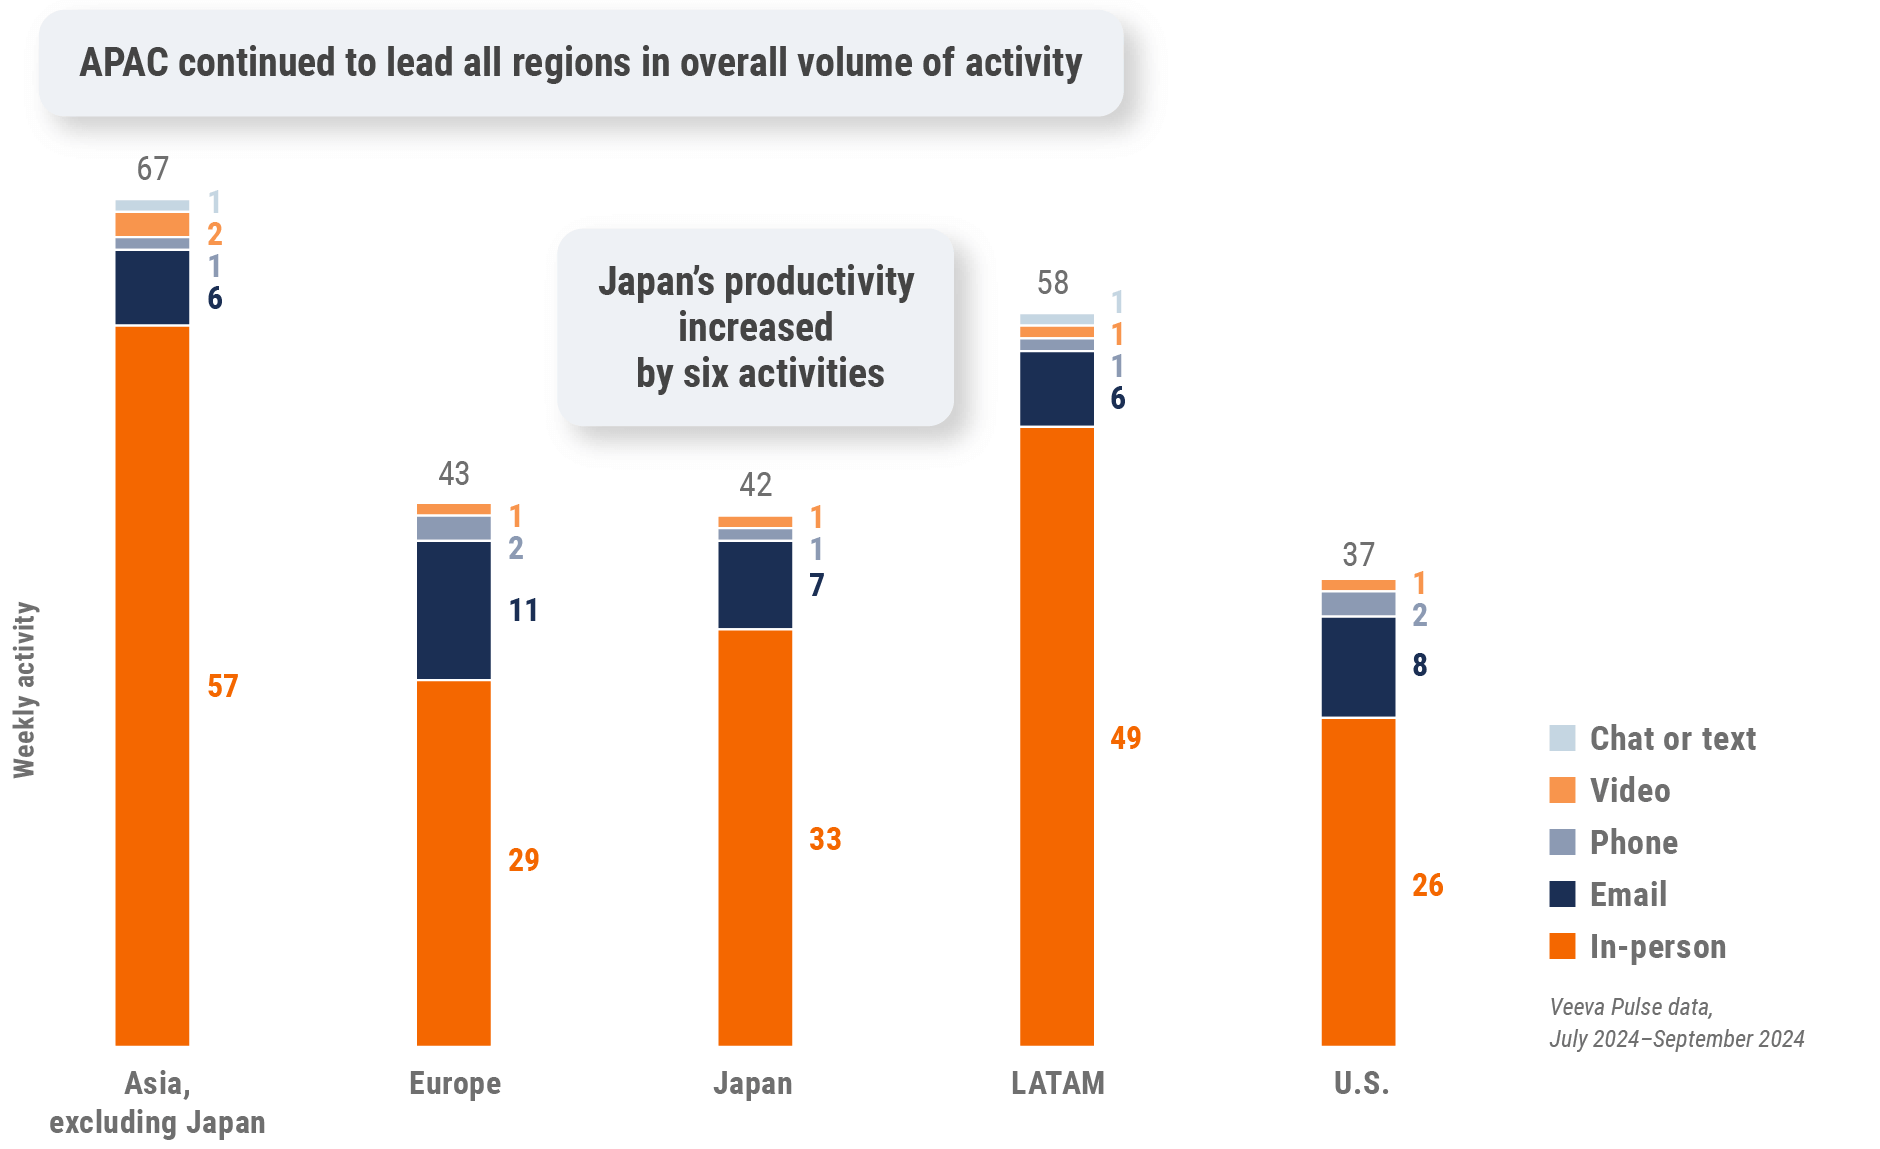
Figure 4: Activity by user type, global
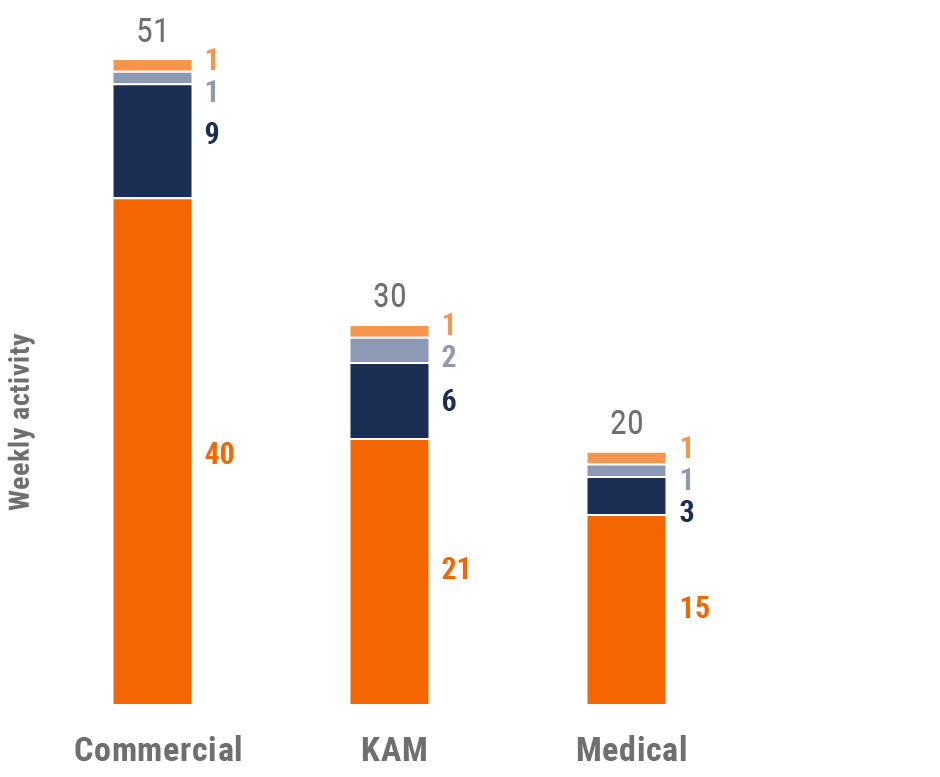
Figure 5: Activity by company size, global
Global engagement quality Consolidation of key quality metrics
Figure 6: Approved email volume, global
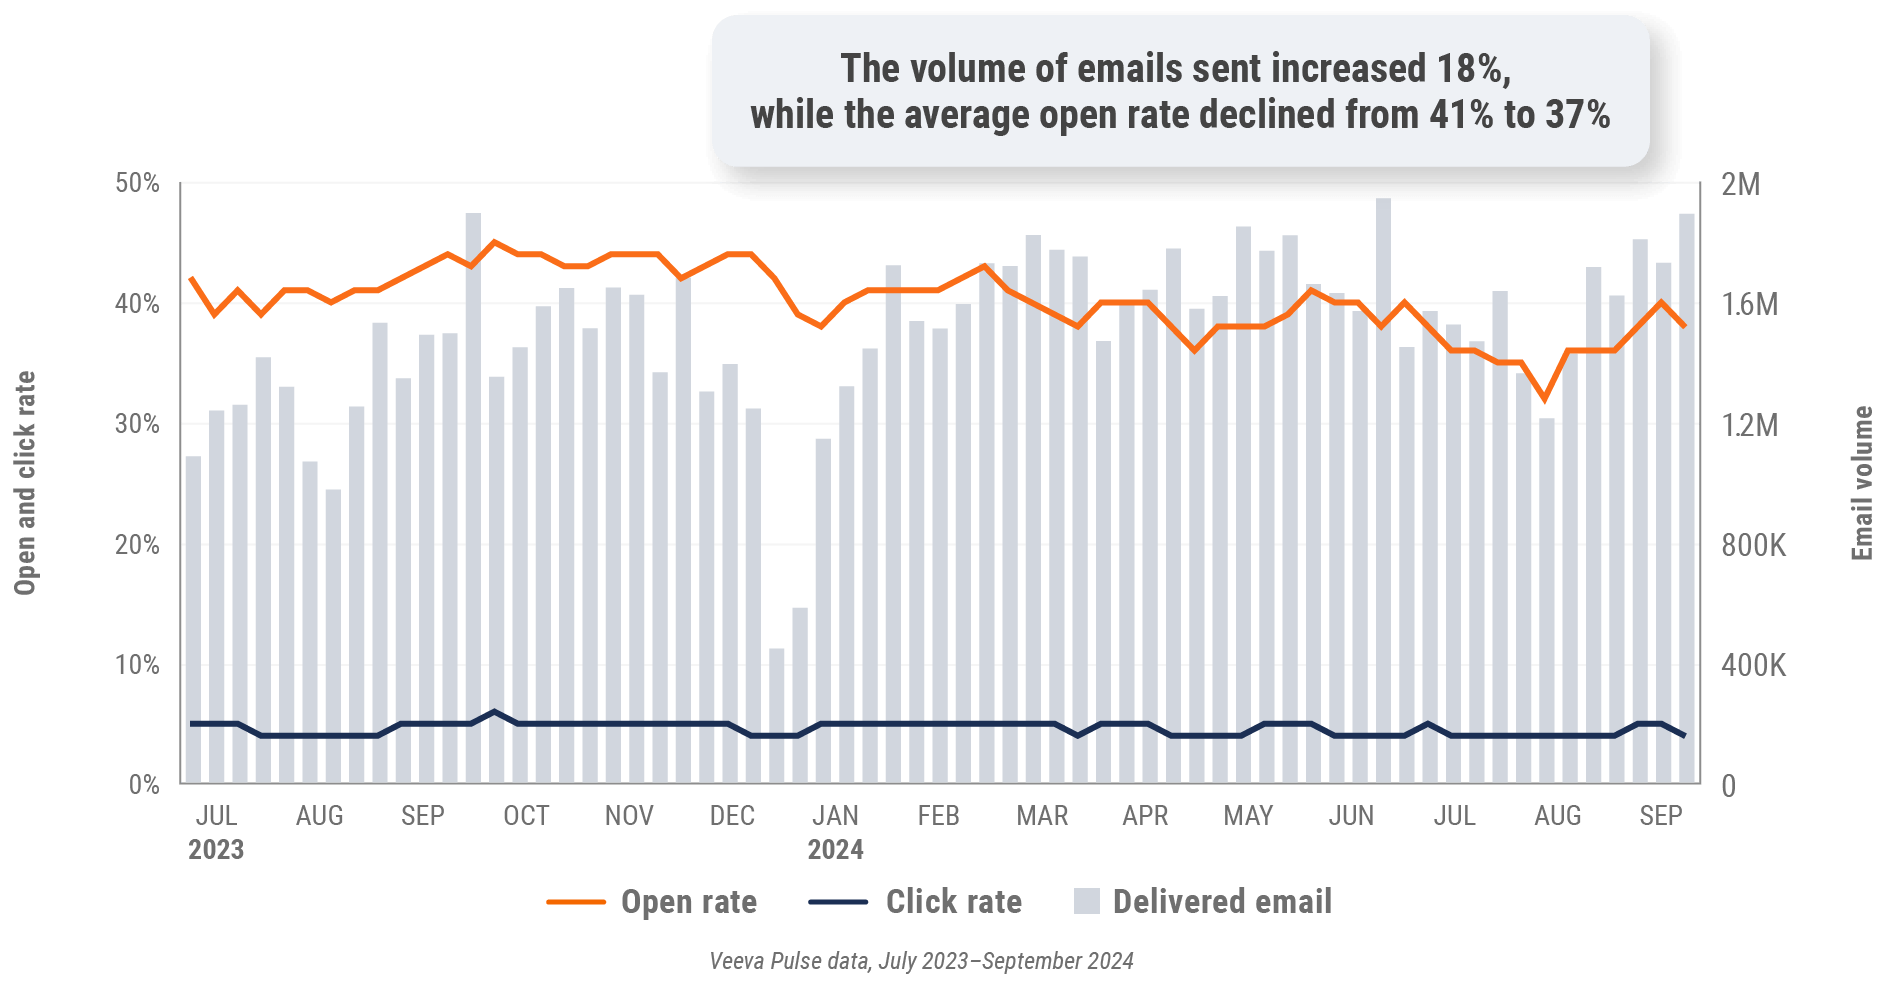
Figure 7: Content usage by channel, global

Figure 8: Veeva CRM Engage meeting duration, global

*This quarter’s global trends report omits data from China.
U.S. market trends
Figure 9: Channel mix evolution, U.S.
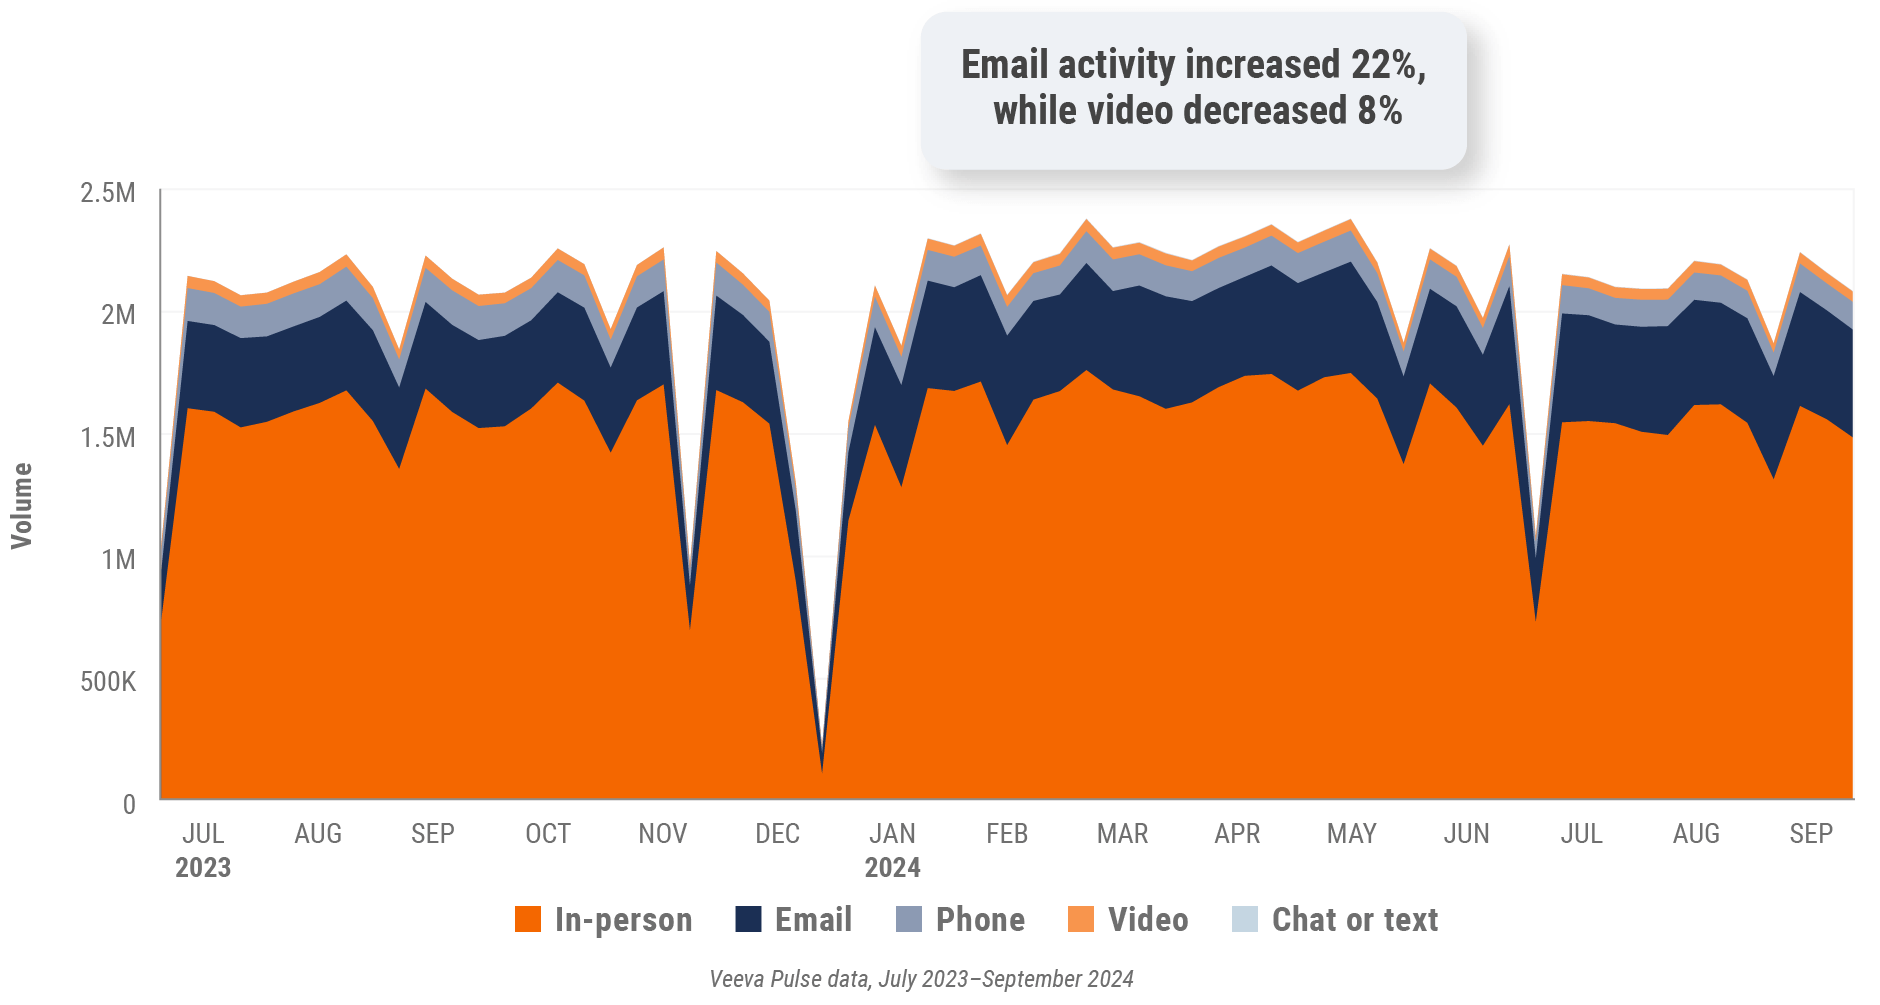
Figure 10: Channel mix, U.S.

U.S. field team activity Weekly activity per user by engagement channel
Figure 11: Activity, U.S.
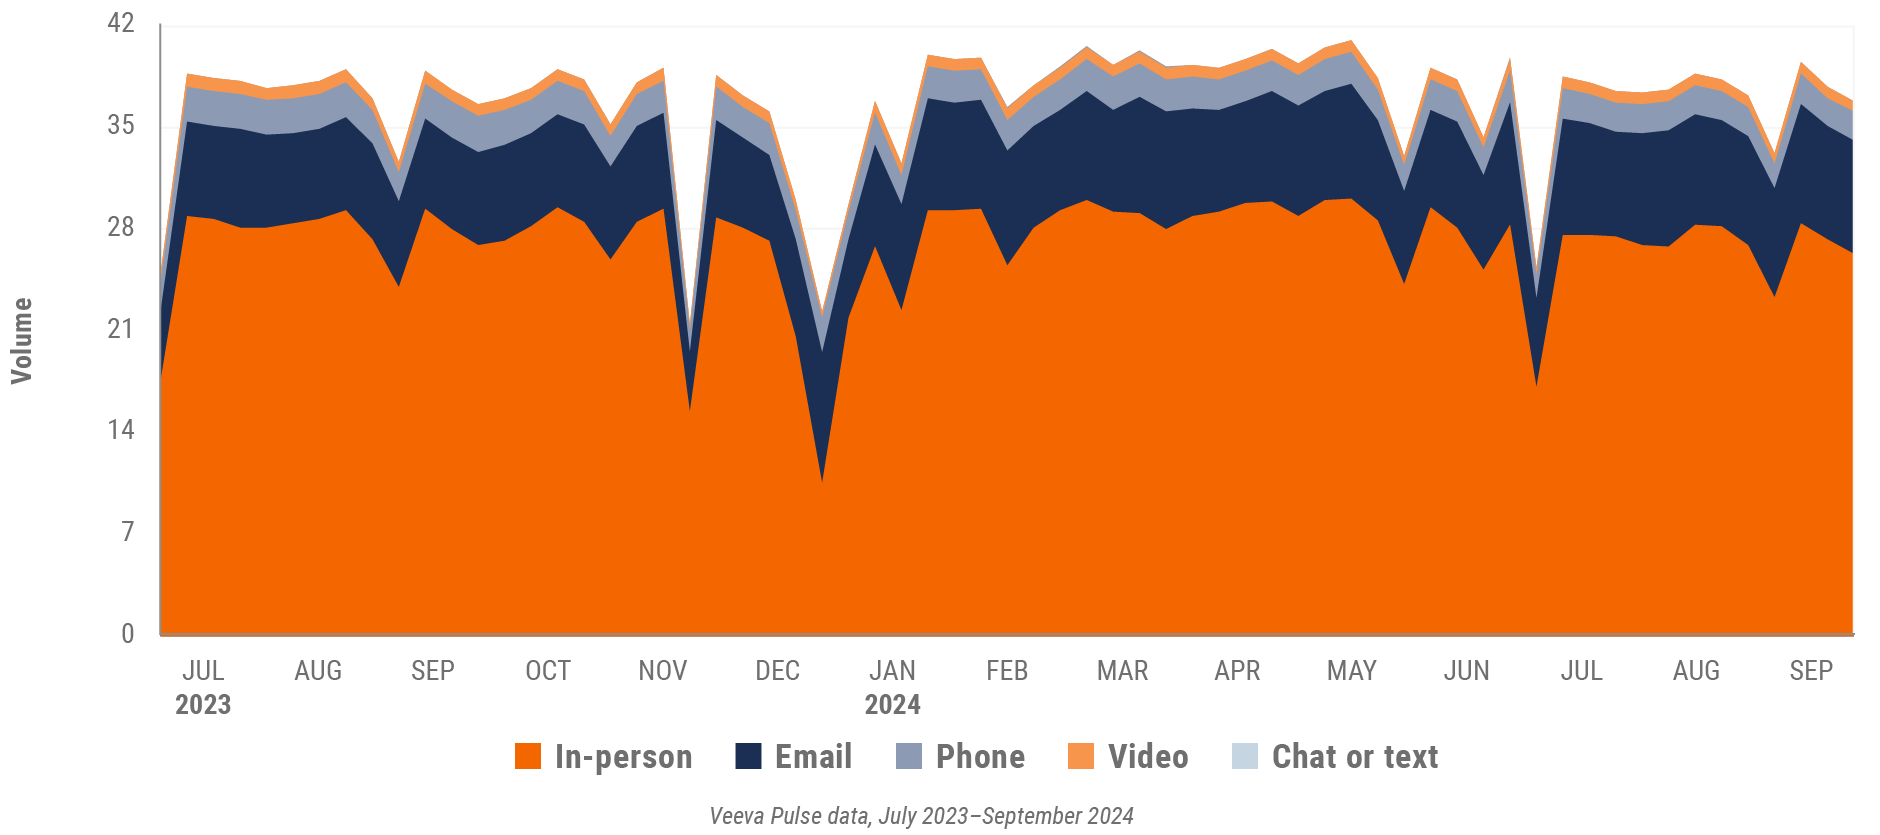
Figure 12: Activity by user type, U.S.
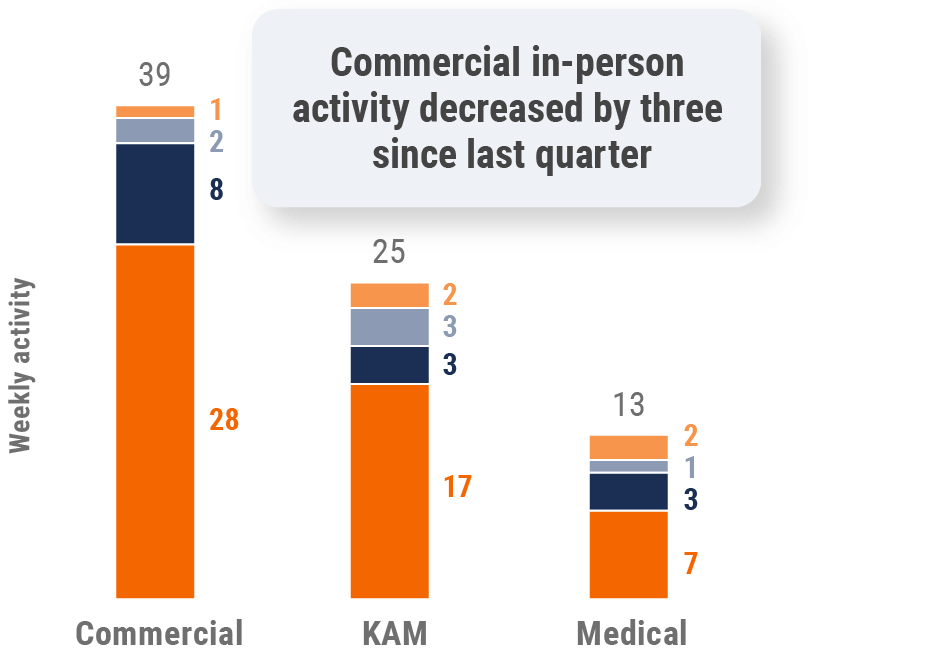
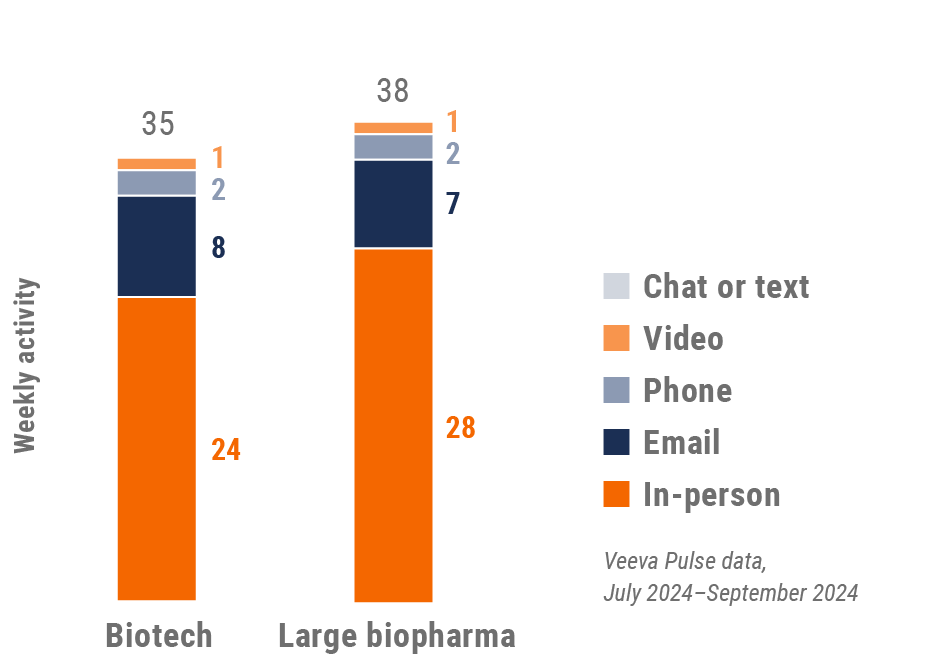
Figure 13: Activity by company size, U.S.
U.S. engagement quality Consolidation of key quality metrics
Figure 14: Approved email volume, U.S.
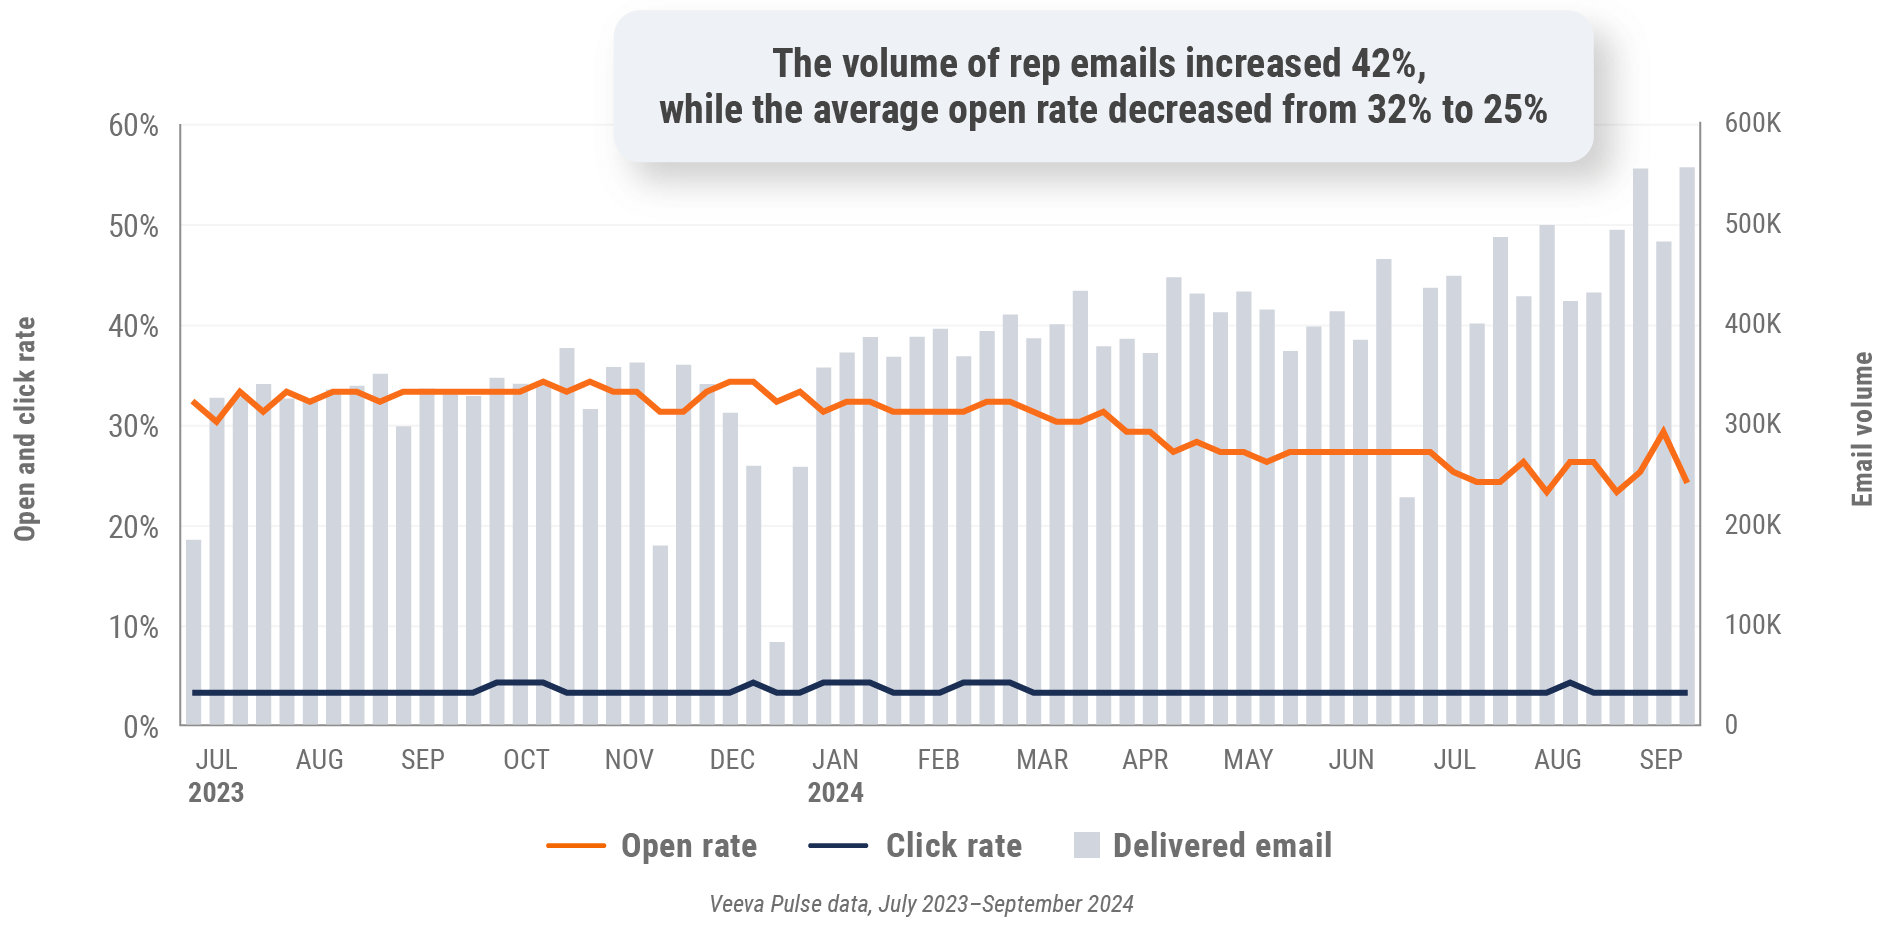
Figure 15: Content usage by channel, U.S.
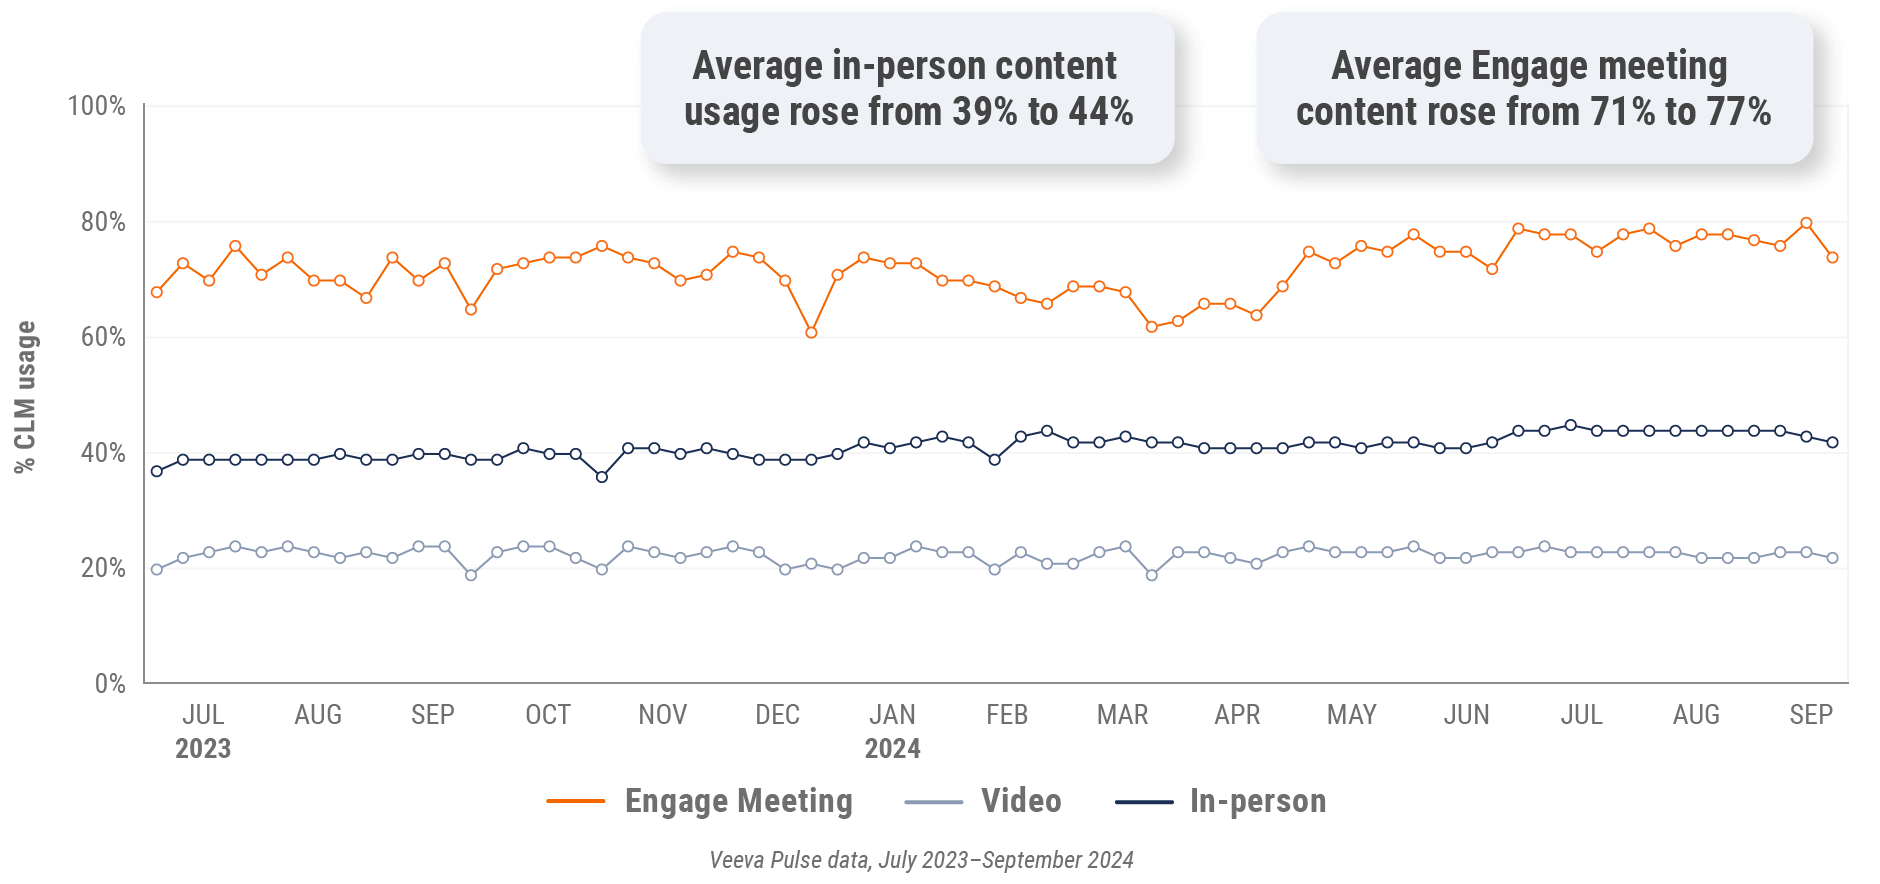
Figure 16: Veeva CRM Engage meeting duration, U.S.

Europe market trends
Figure 17: Channel mix evolution, Europe
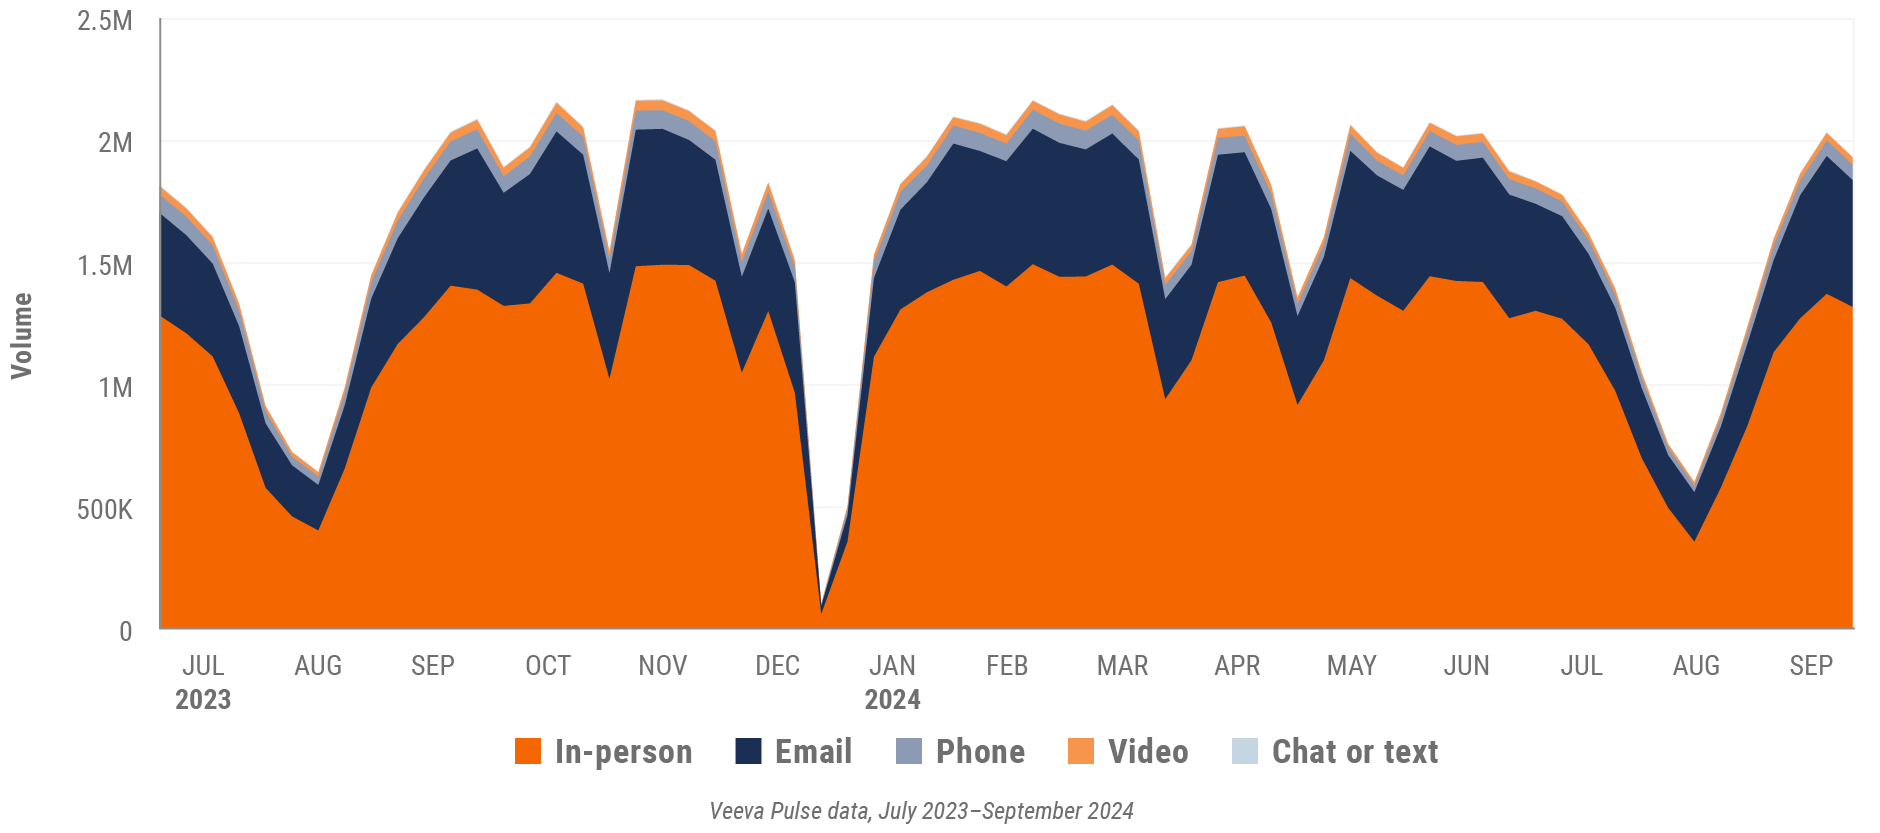
Figure 18: Channel mix, Europe

Europe field team activity Weekly activity per user by engagement channel
Figure 19: Activity by country, EU5
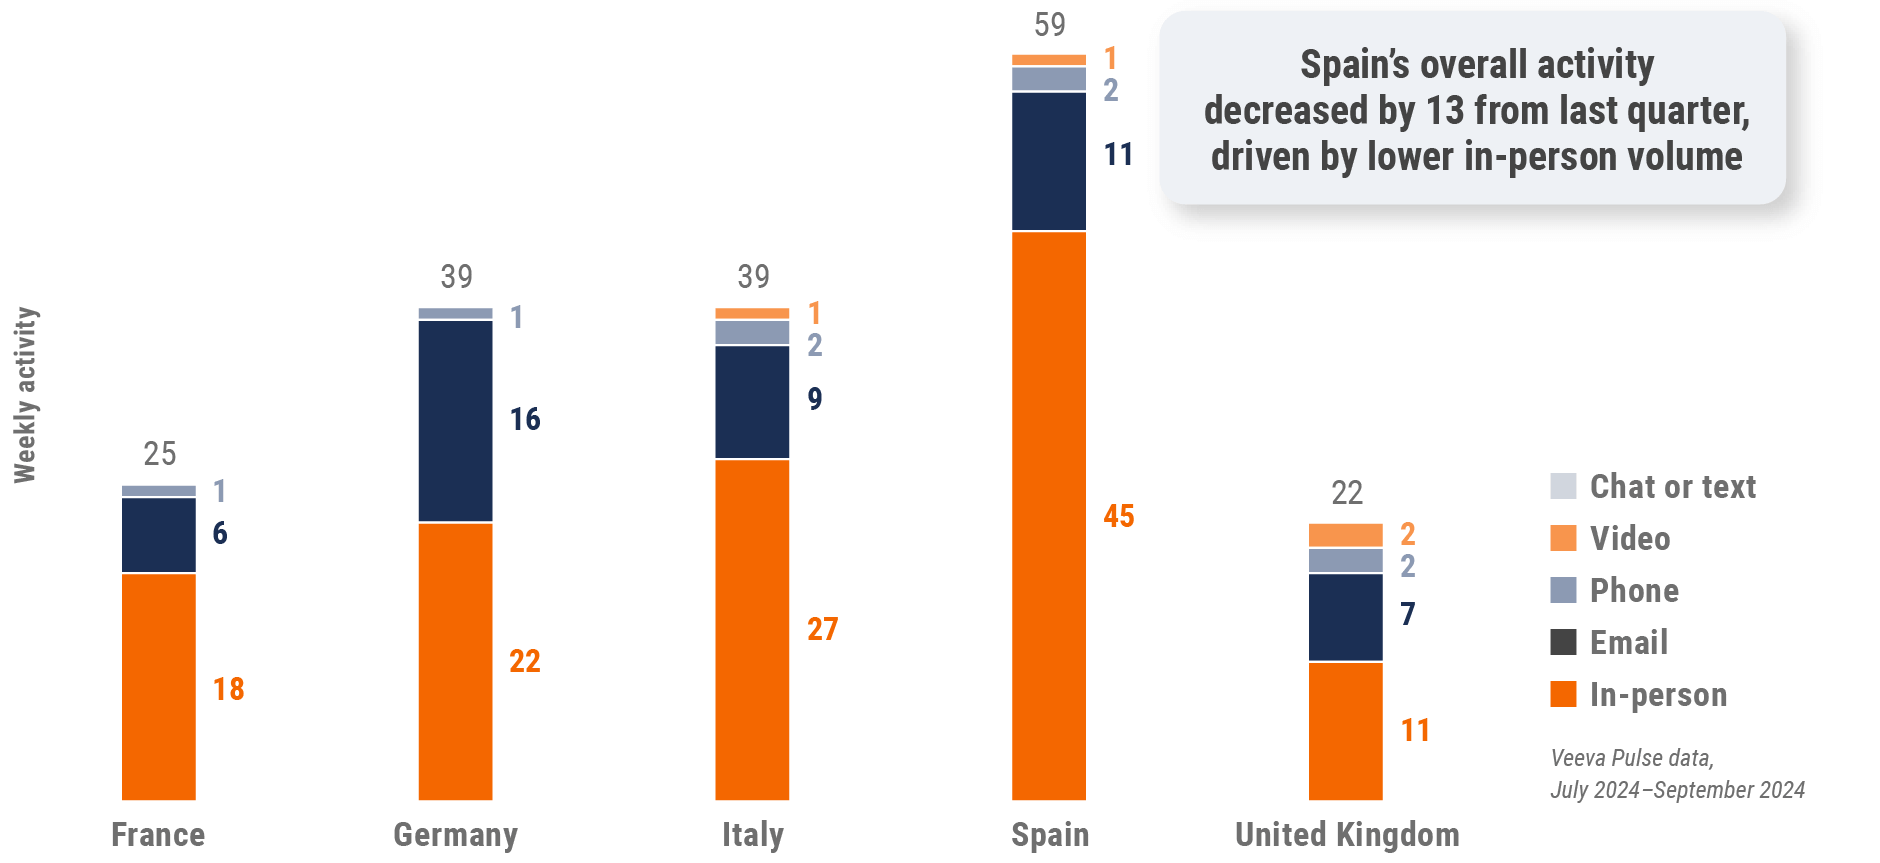
Figure 20: Activity by user type, Europe
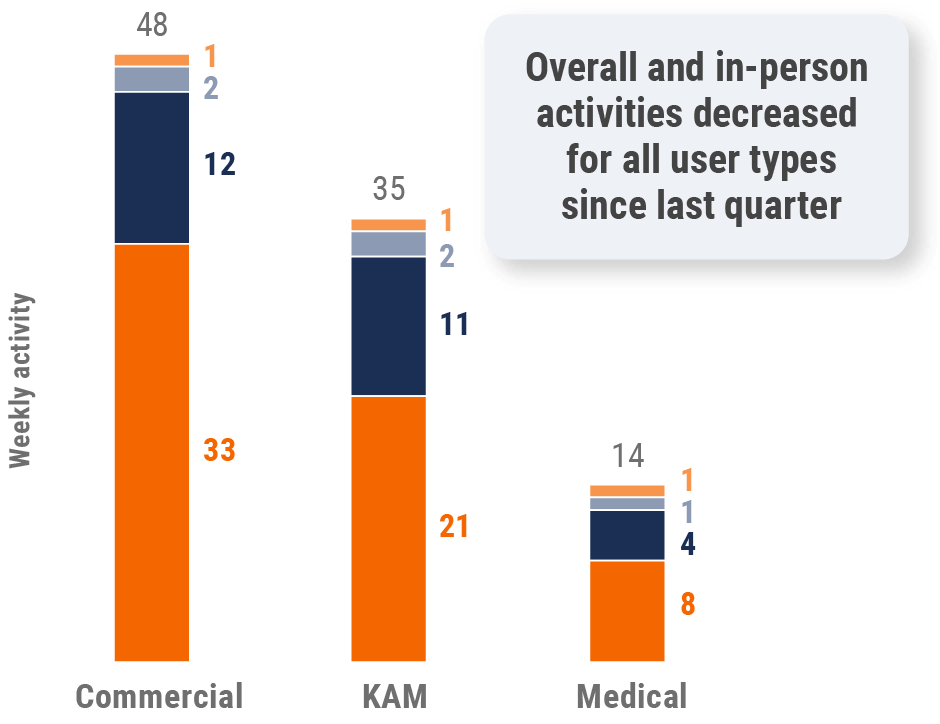
Figure 21: Activity by company size, Europe
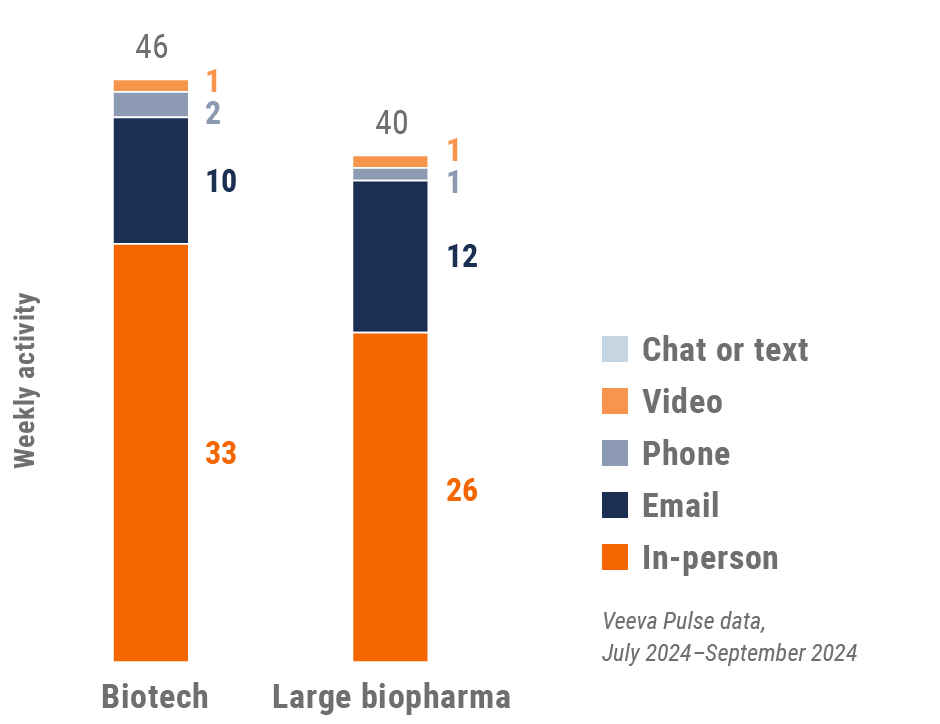
Europe engagement quality Consolidation of key quality metrics
Figure 22: Approved email volume, Europe
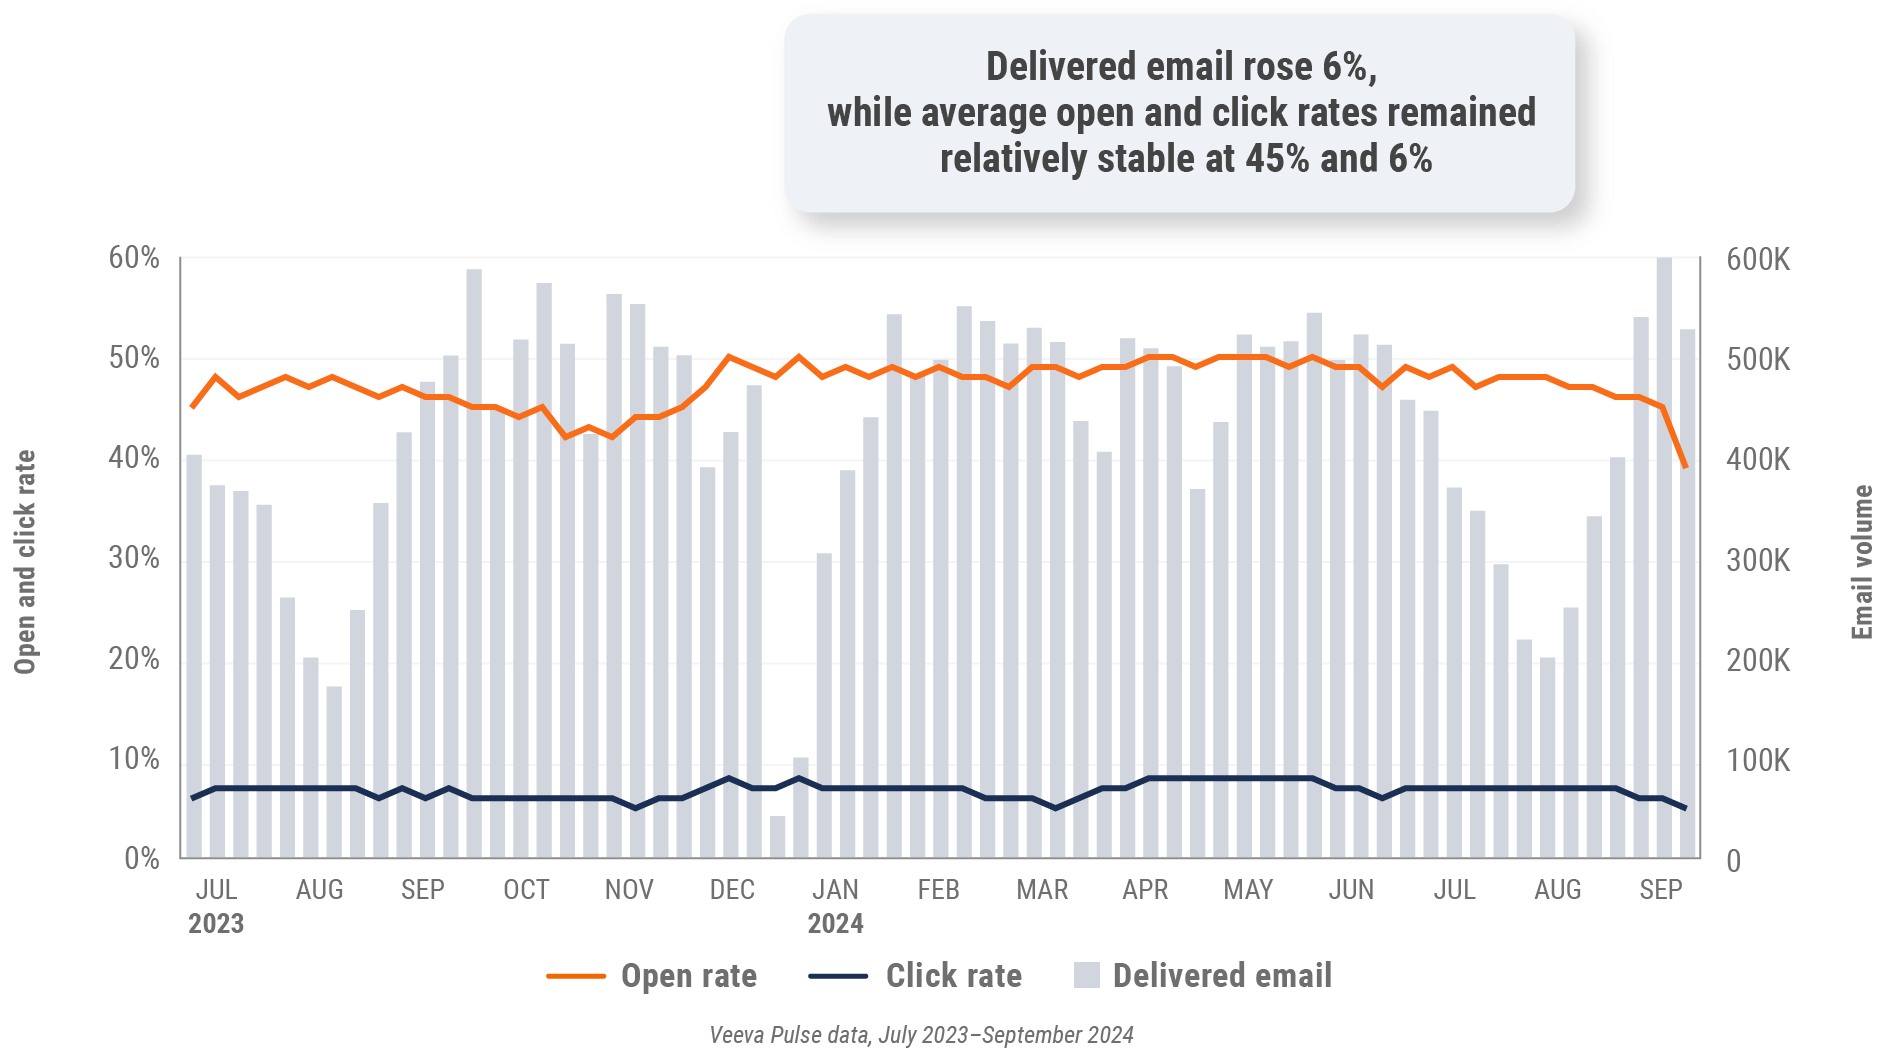
Figure 23: Content usage by channel, Europe
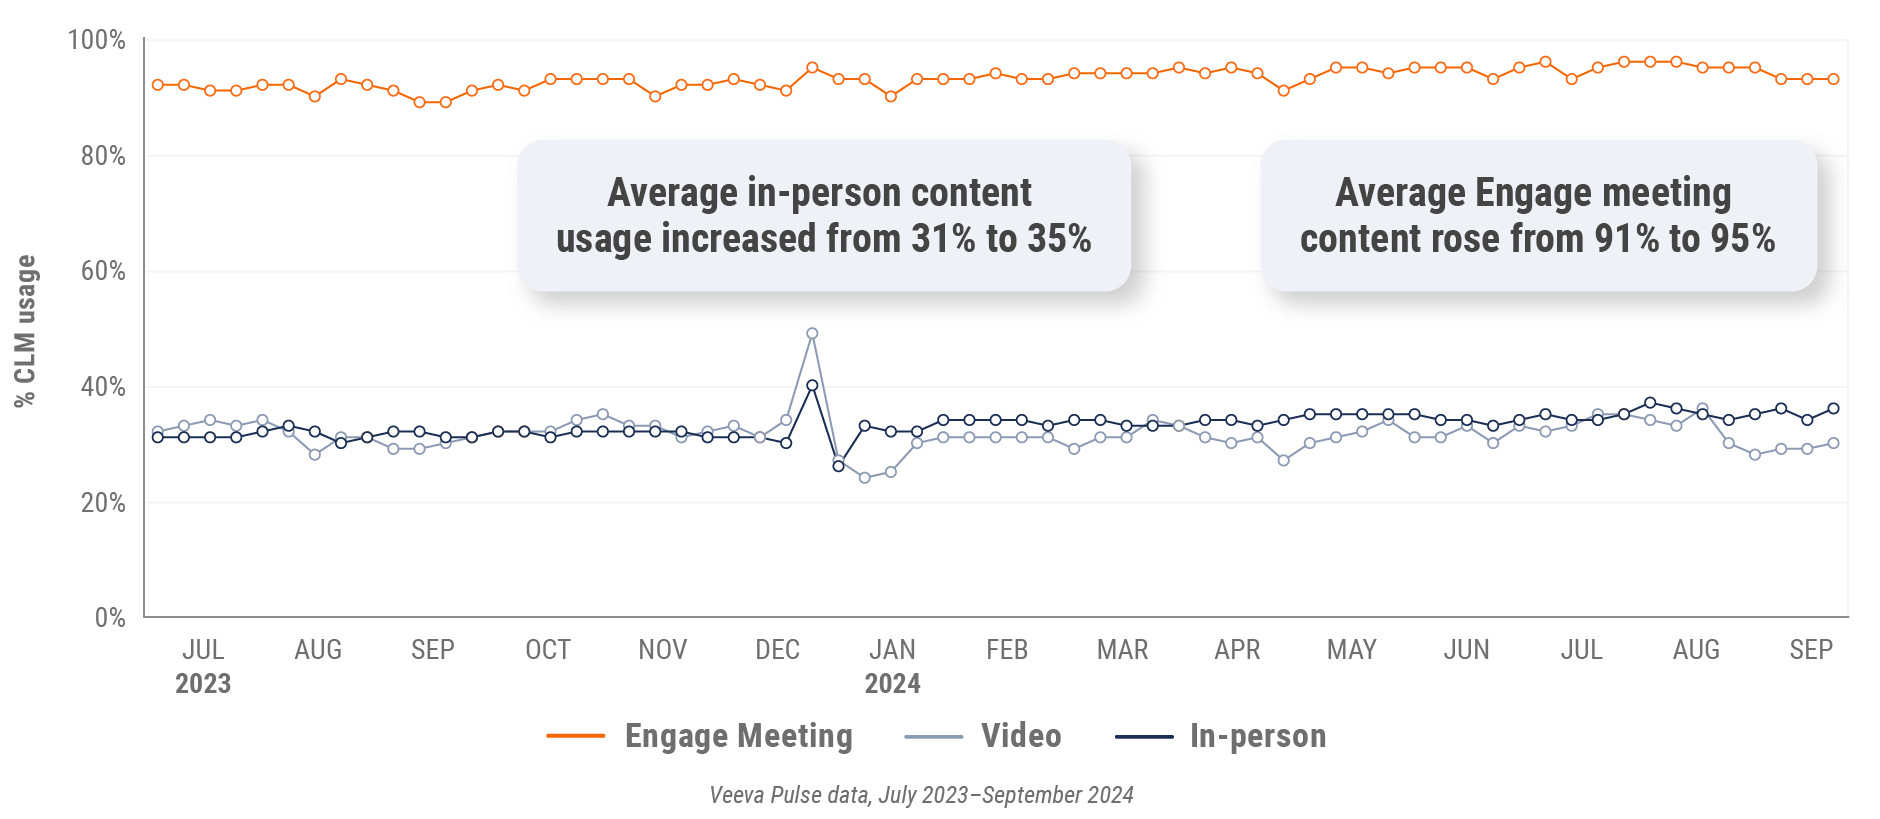
Figure 24: Veeva CRM Engage meeting duration, Europe

Asia market trends
Figure 25: Channel mix evolution, Asia
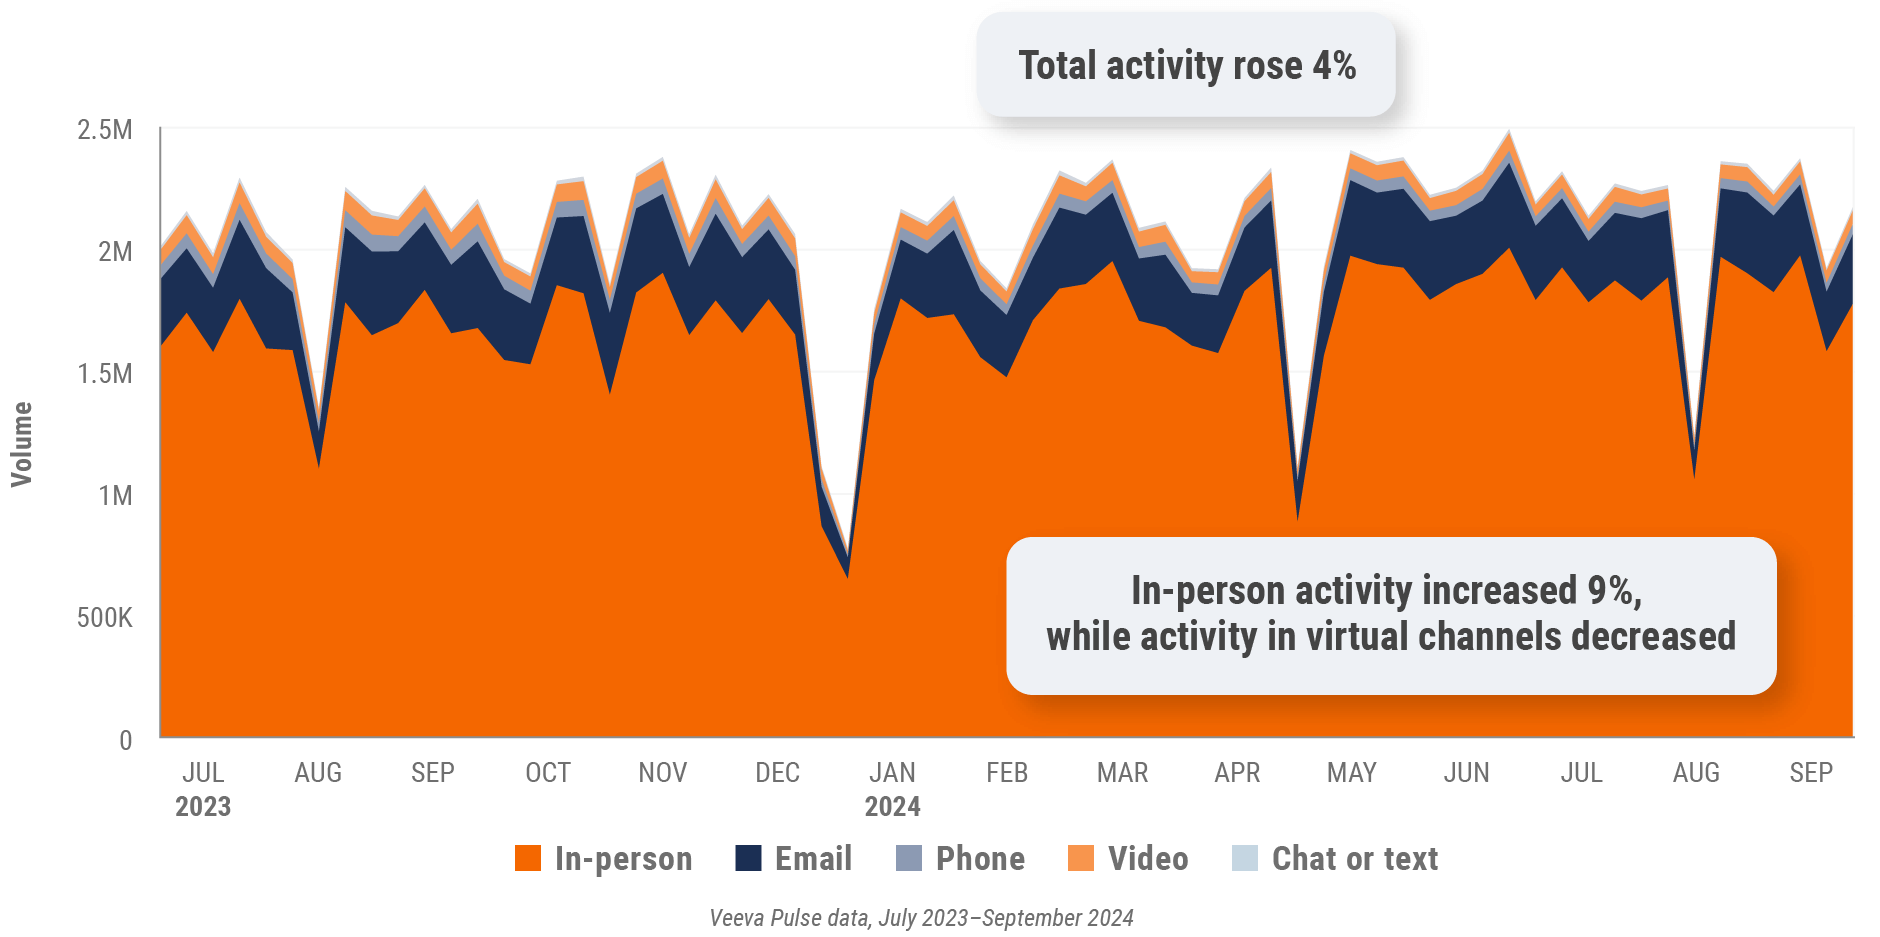
Figure 26: Channel mix, Asia

Asia field team activity Weekly activity per user by engagement channel
Figure 27: Activity by country, Asia
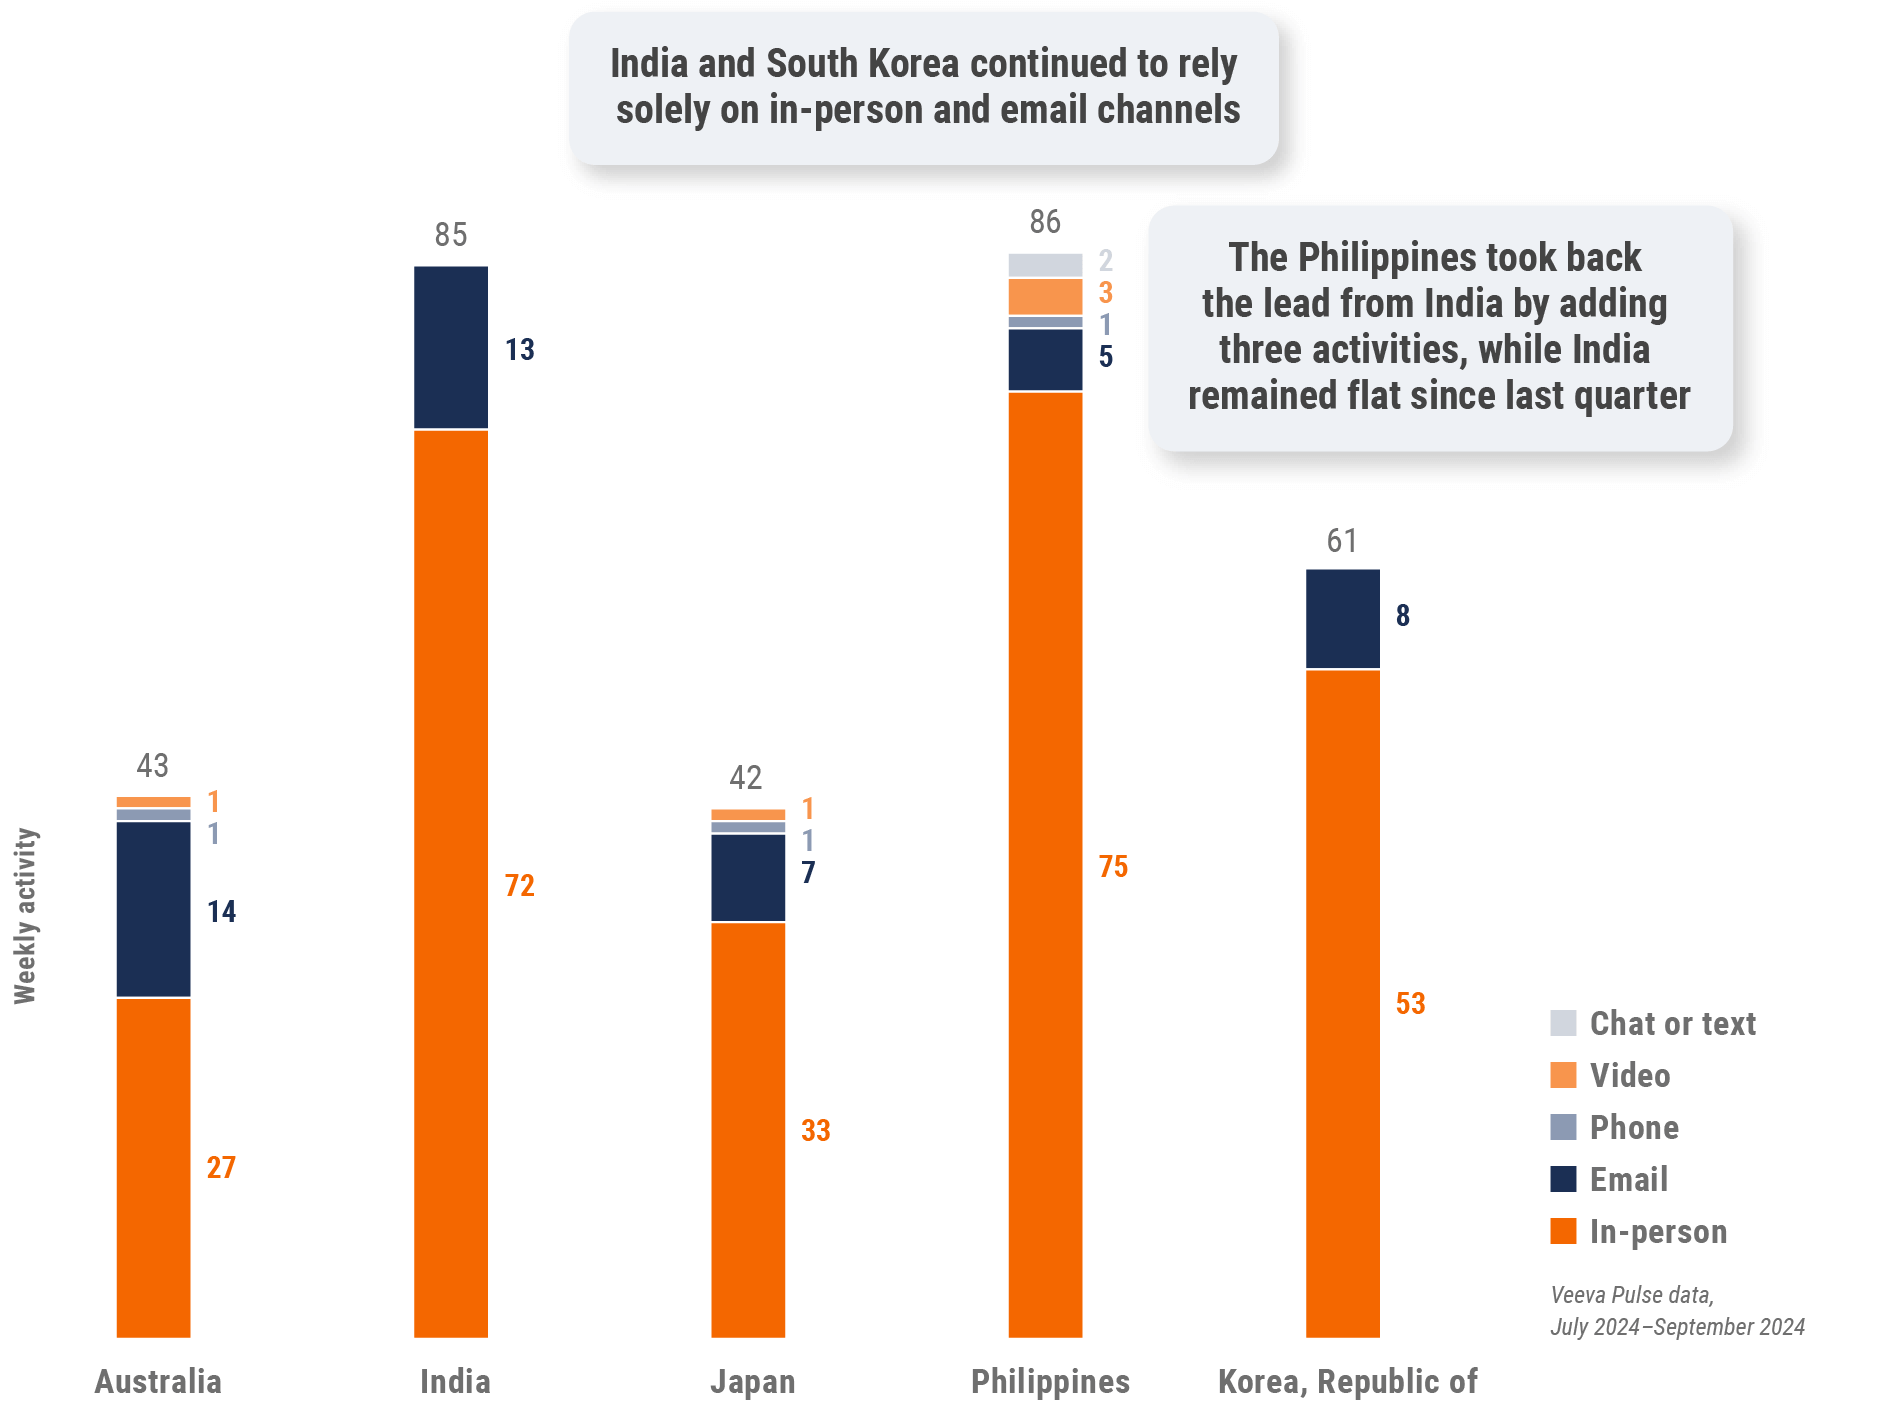
Figure 28: Activity by user type, Asia
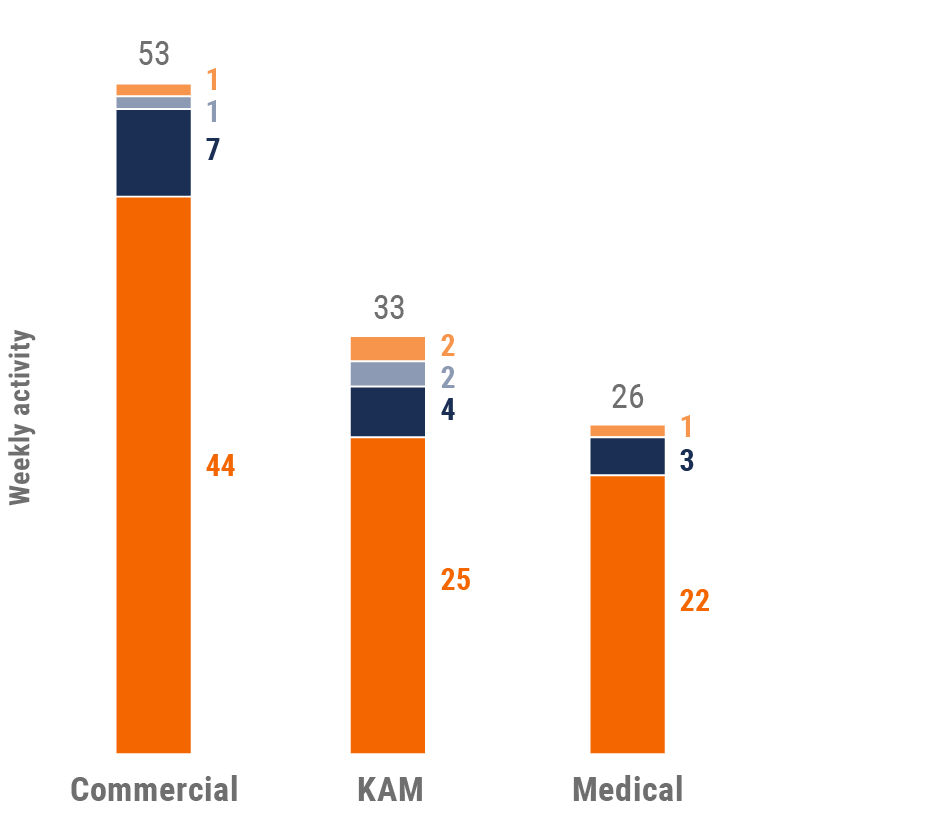
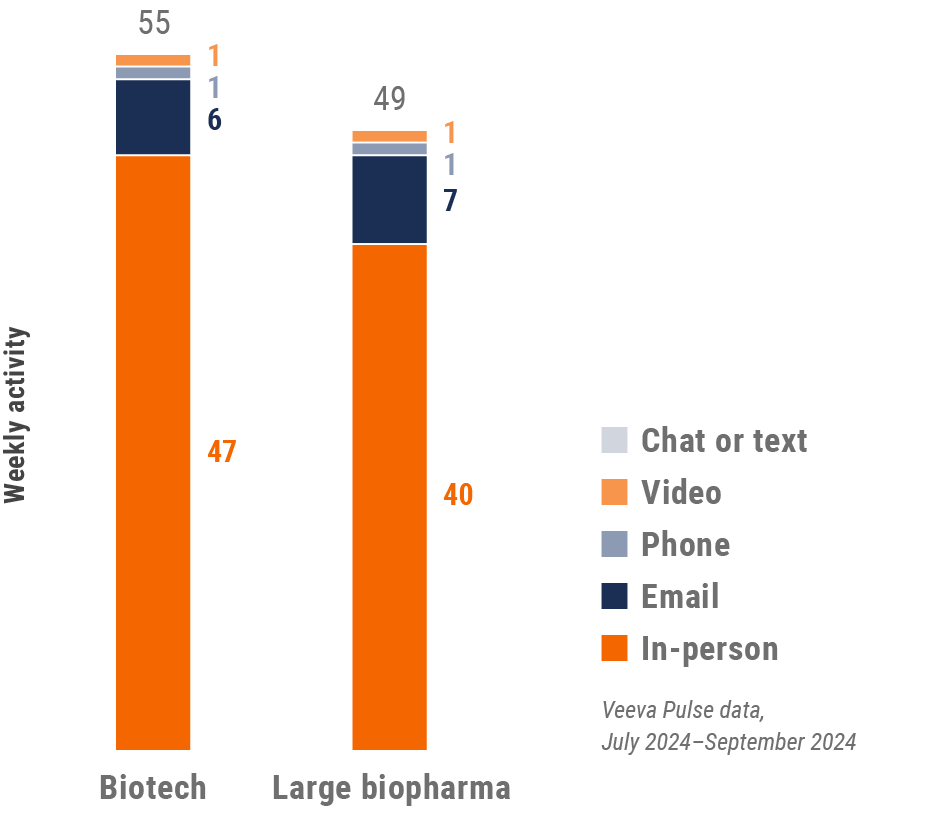
Figure 29: Activity by company size, Asia
Asia engagement quality Consolidation of key quality metrics
Figure 30: Approved email volume, Asia
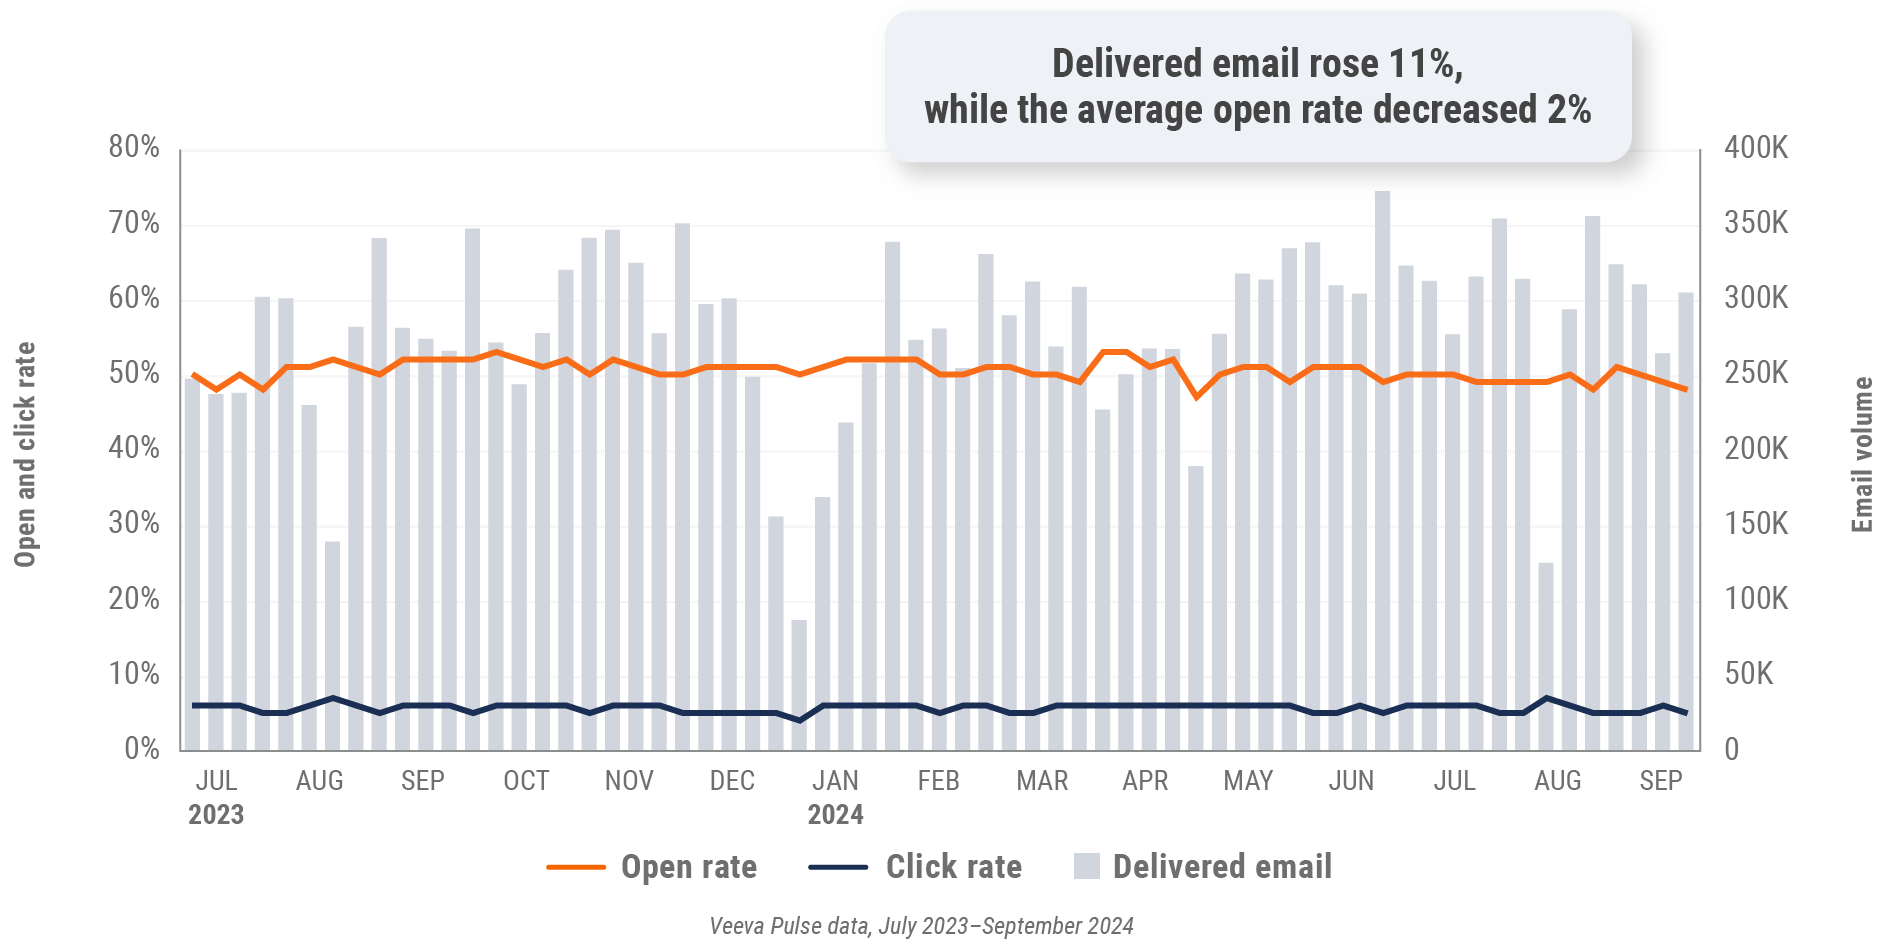
Figure 31: Content usage by channel, Asia
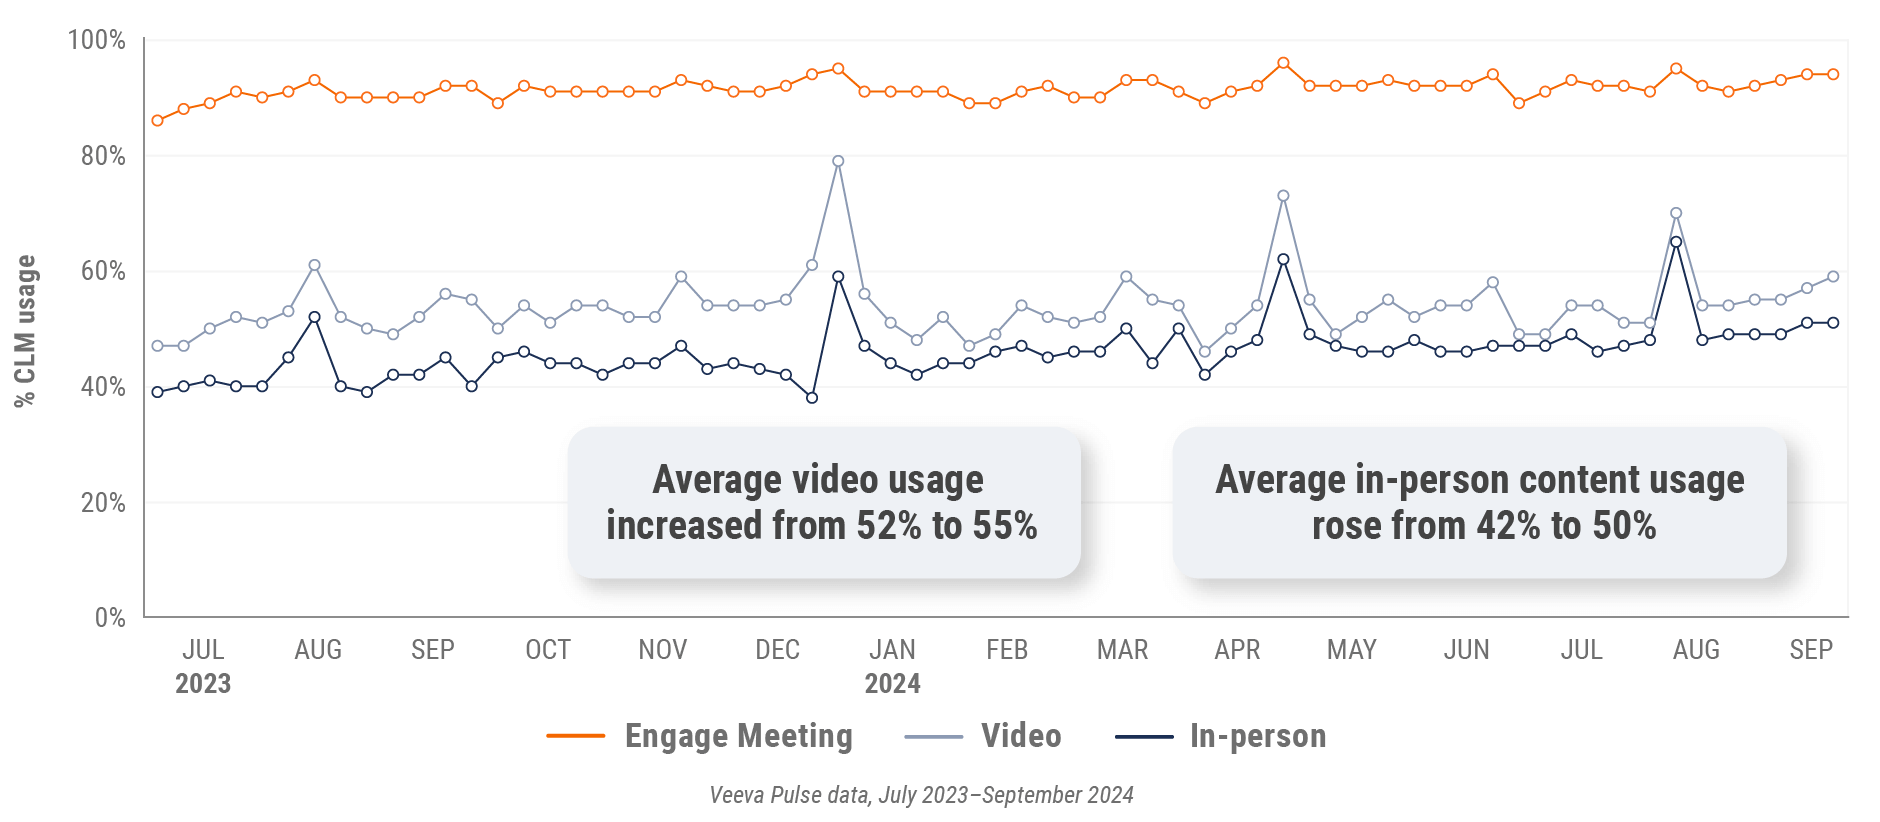
Figure 32: Veeva CRM Engage meeting duration, Asia

Latin America market trends
Figure 33: Channel mix evolution, Latin America
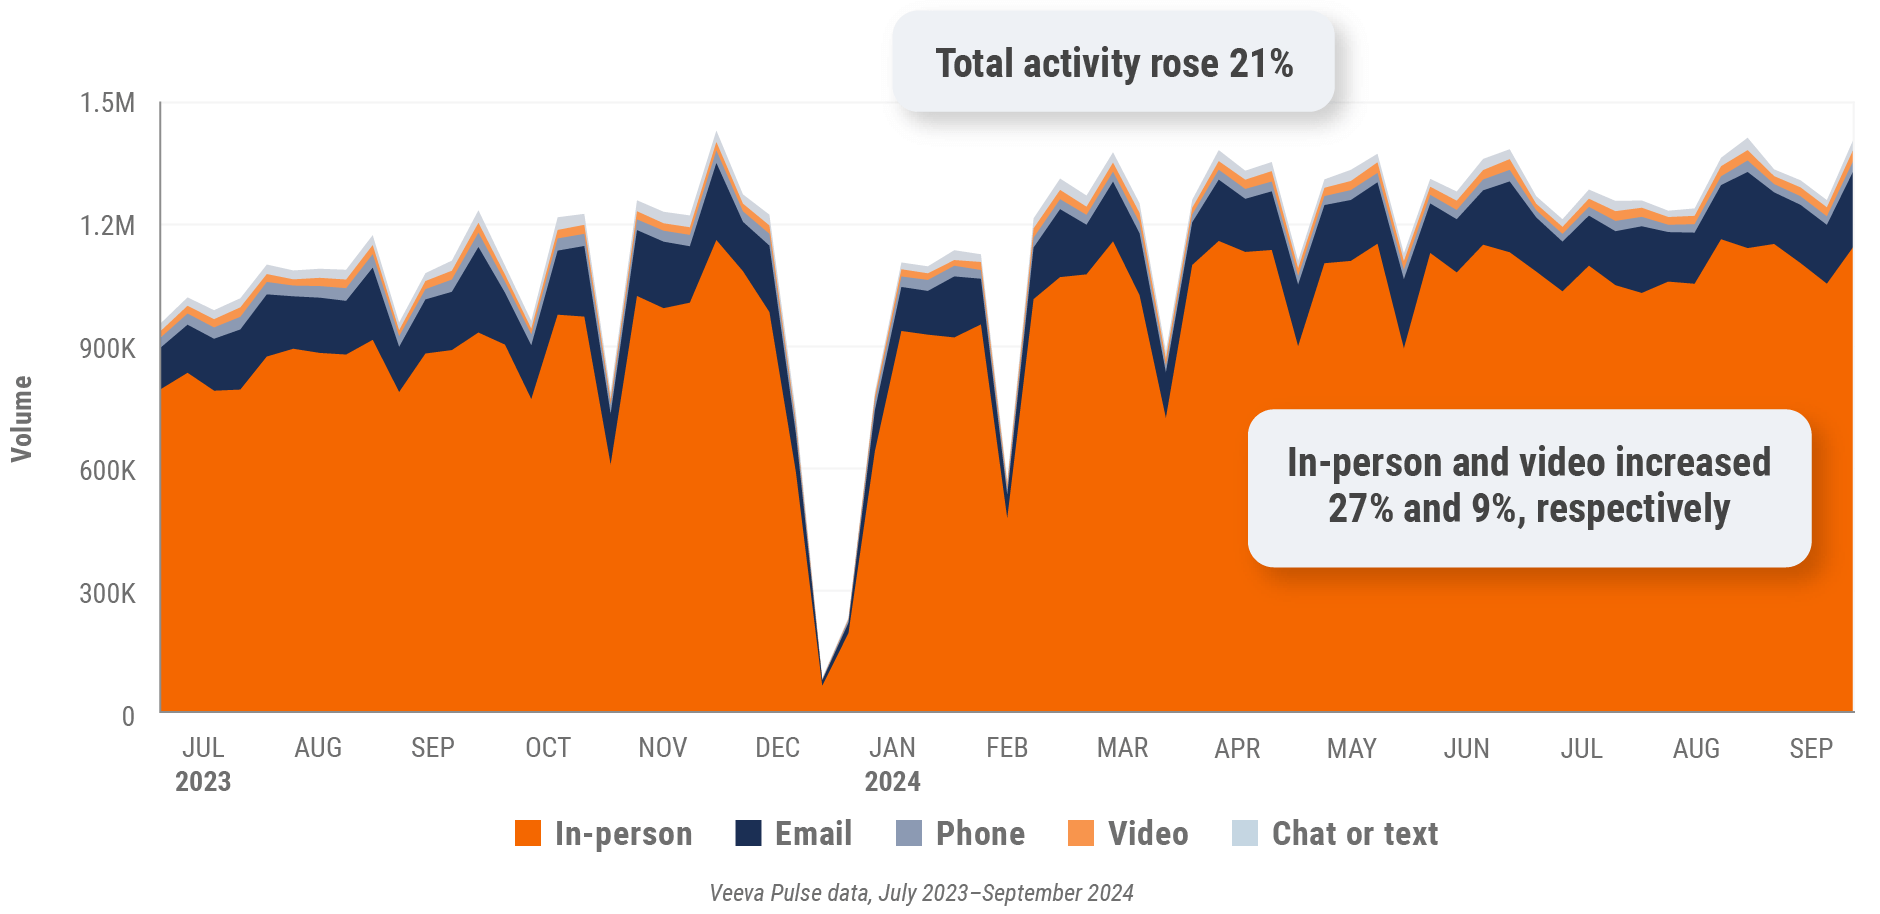
Figure 34: Channel mix, Latin America

Latin America field team activity Weekly activity per user by engagement channel
Figure 35: Activity by country, Latin America
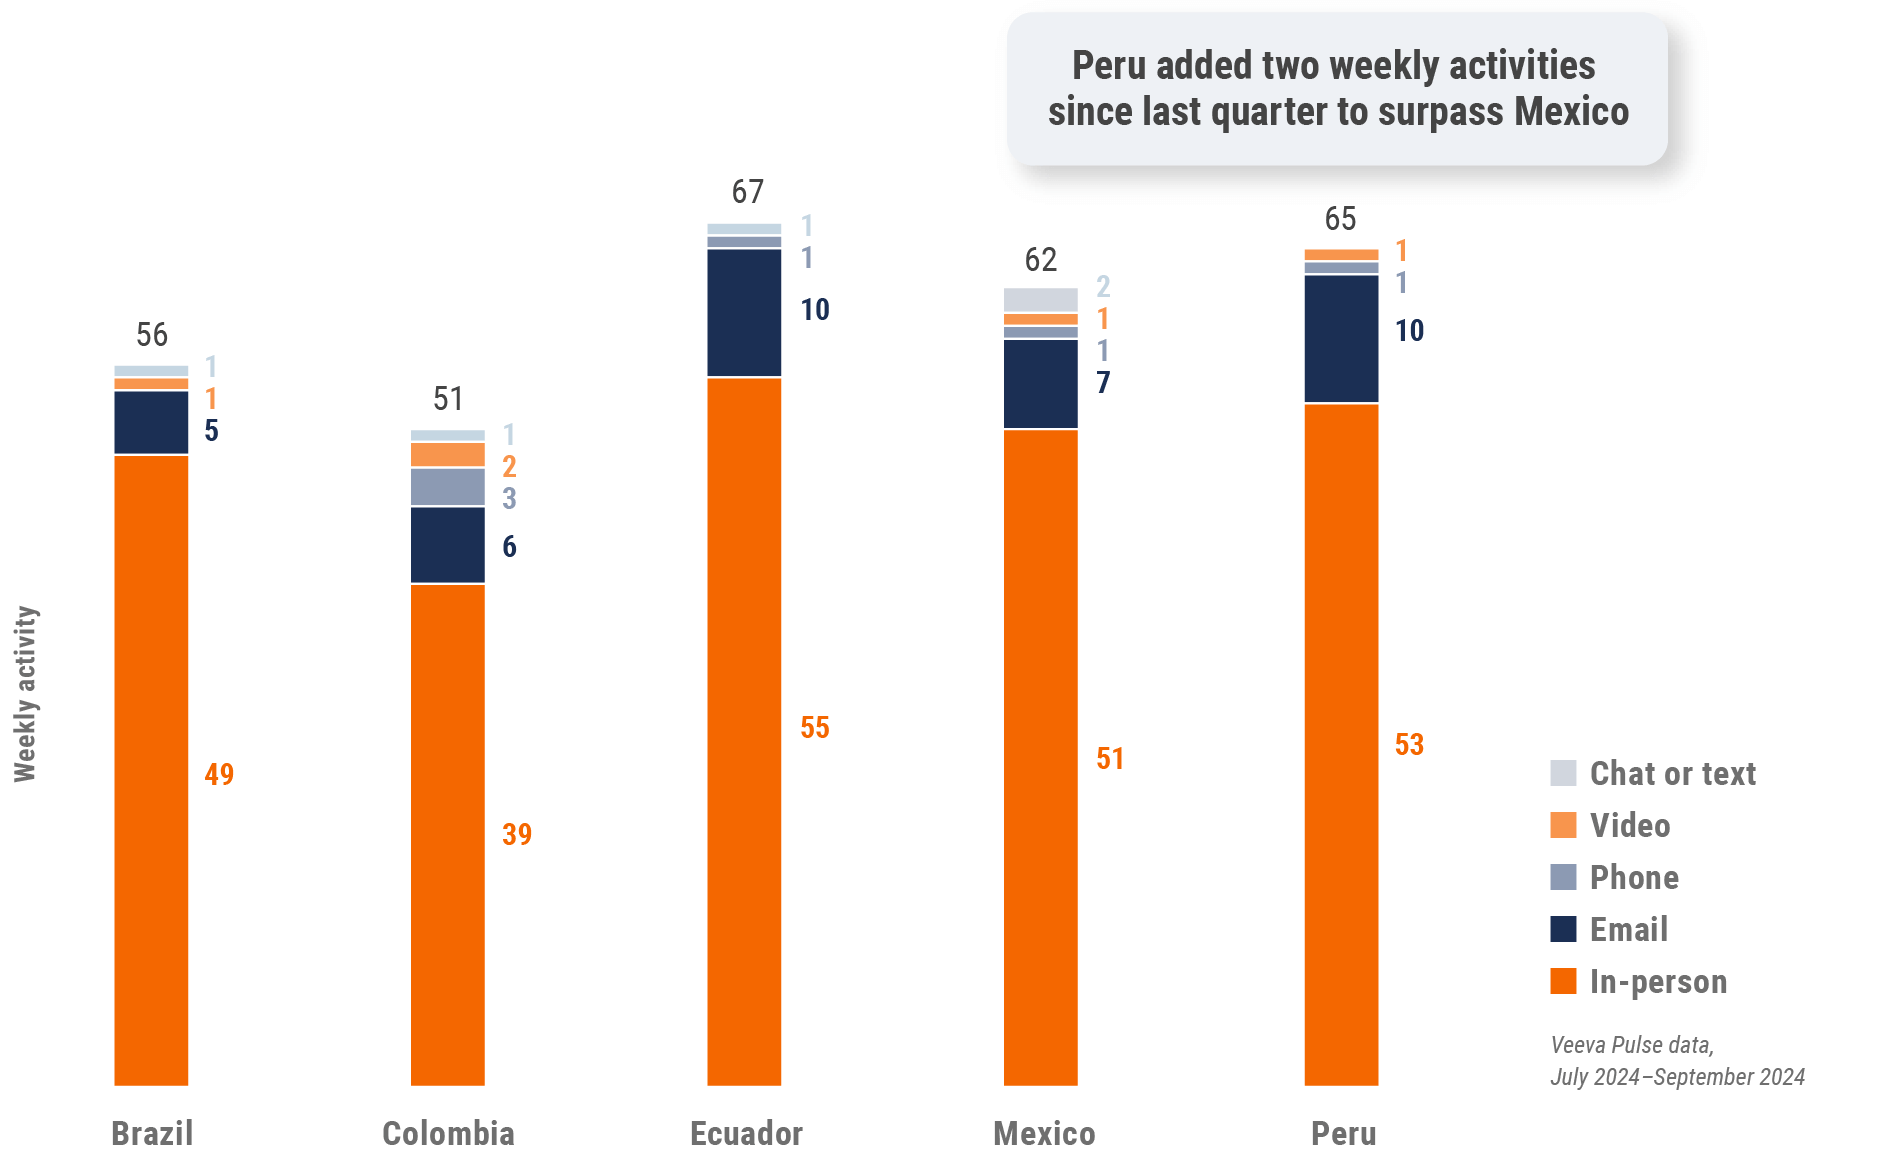
Figure 36: Activity by user type, Latin America
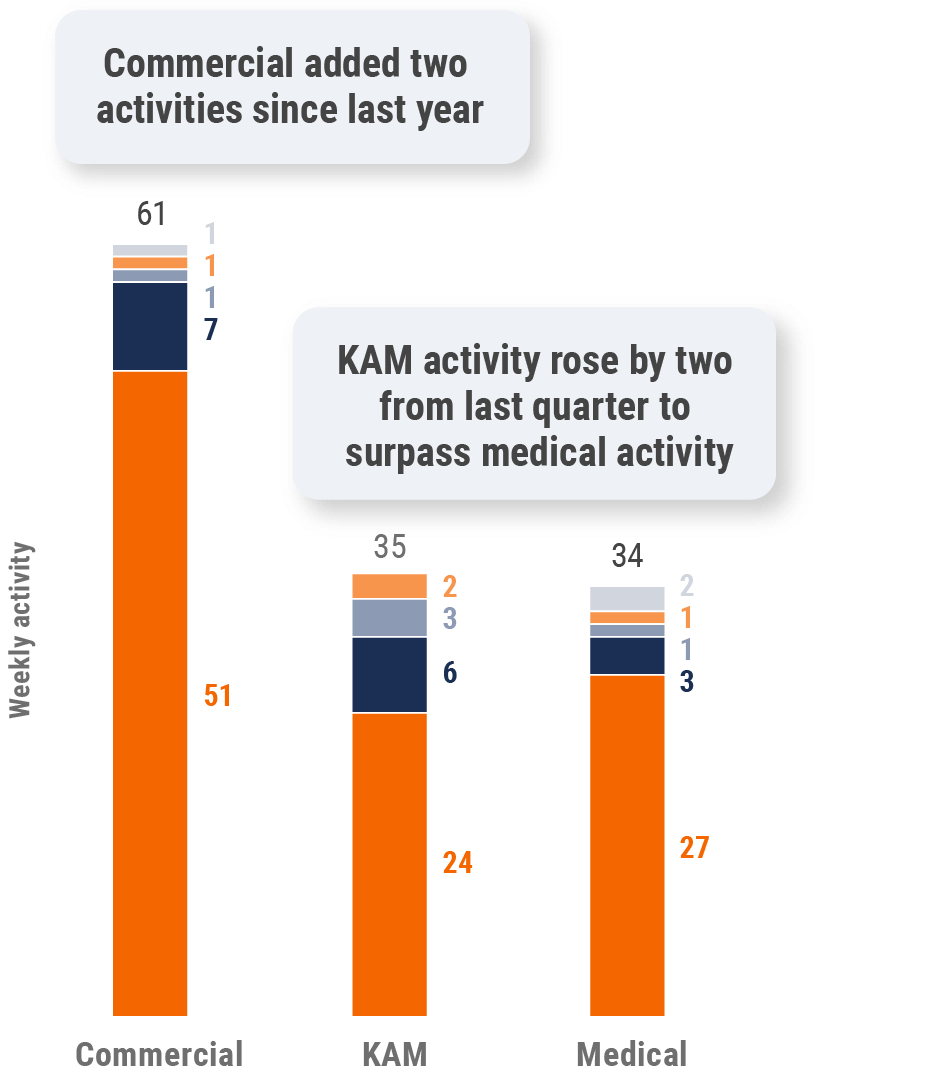
Figure 37: Activity by company size, Latin America
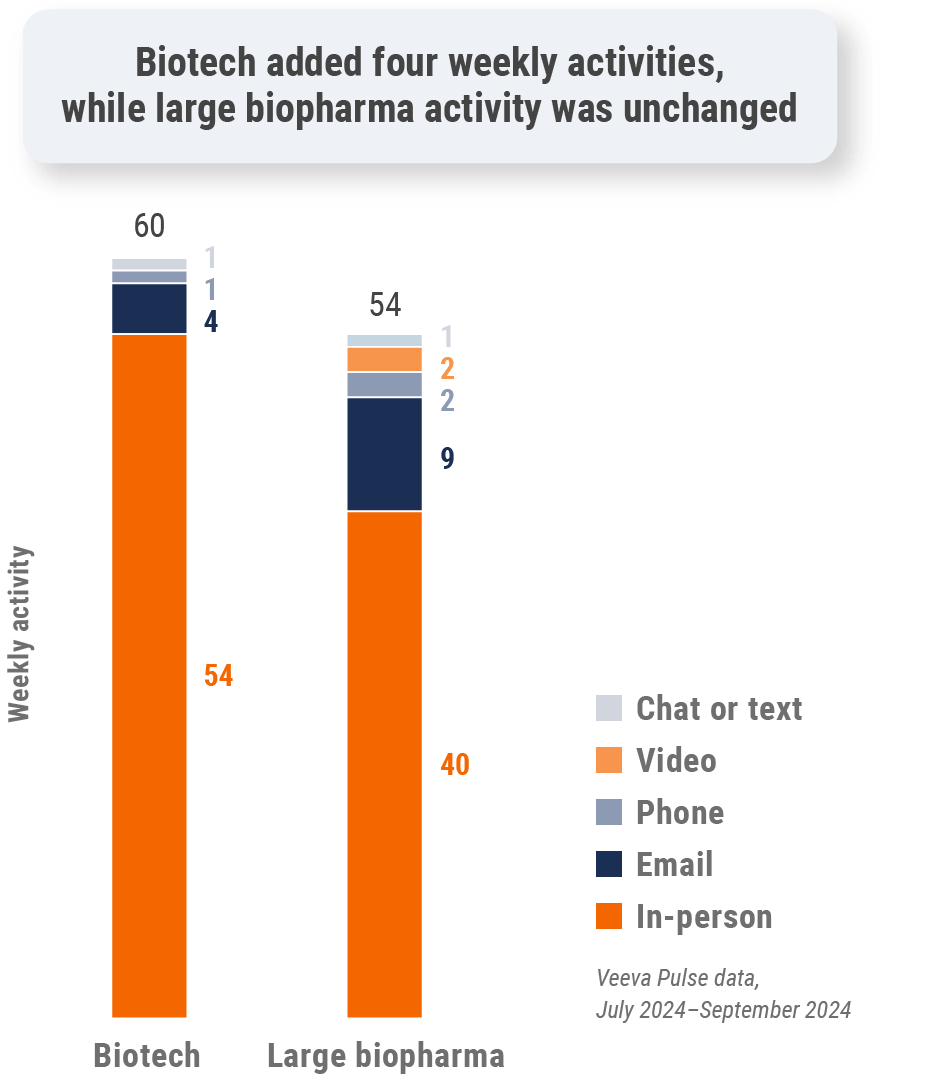
Latin America engagement quality Consolidation of key quality metrics
Figure 38: Approved email volume, Latin America
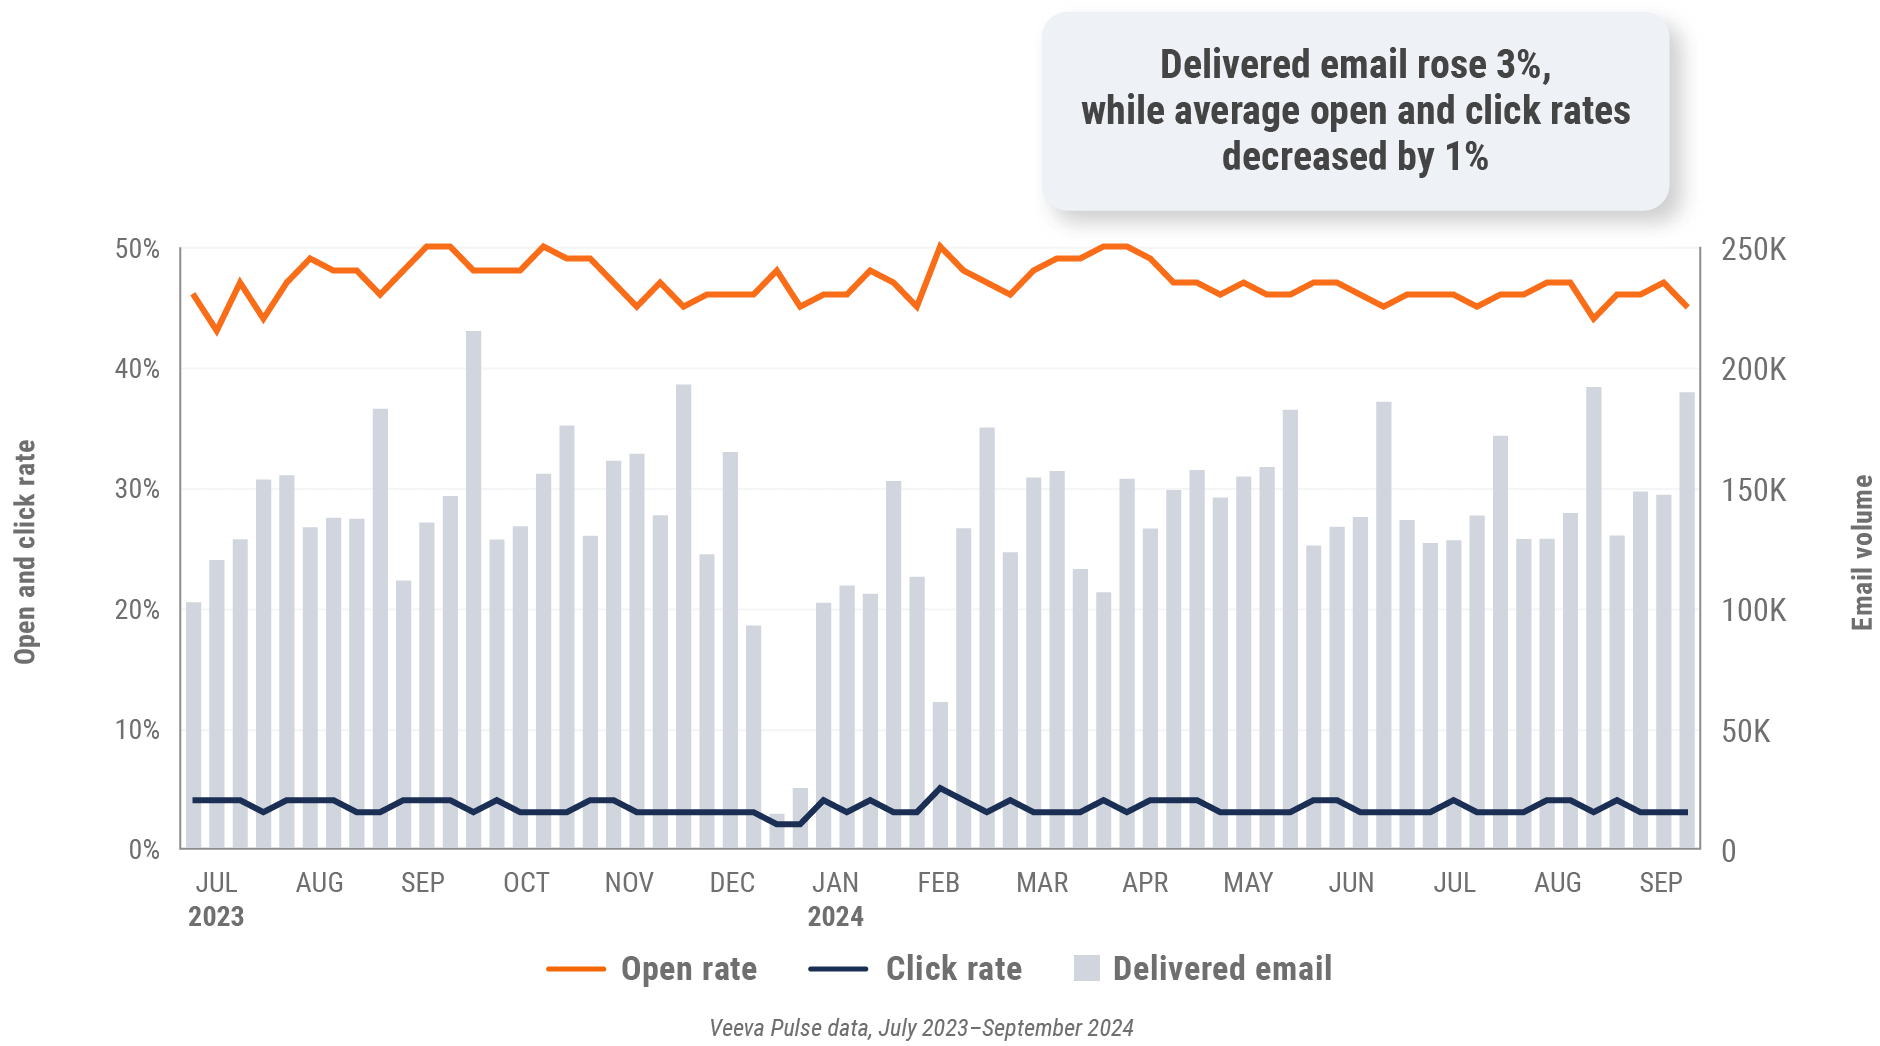
Figure 39: Content usage by channel, Latin America
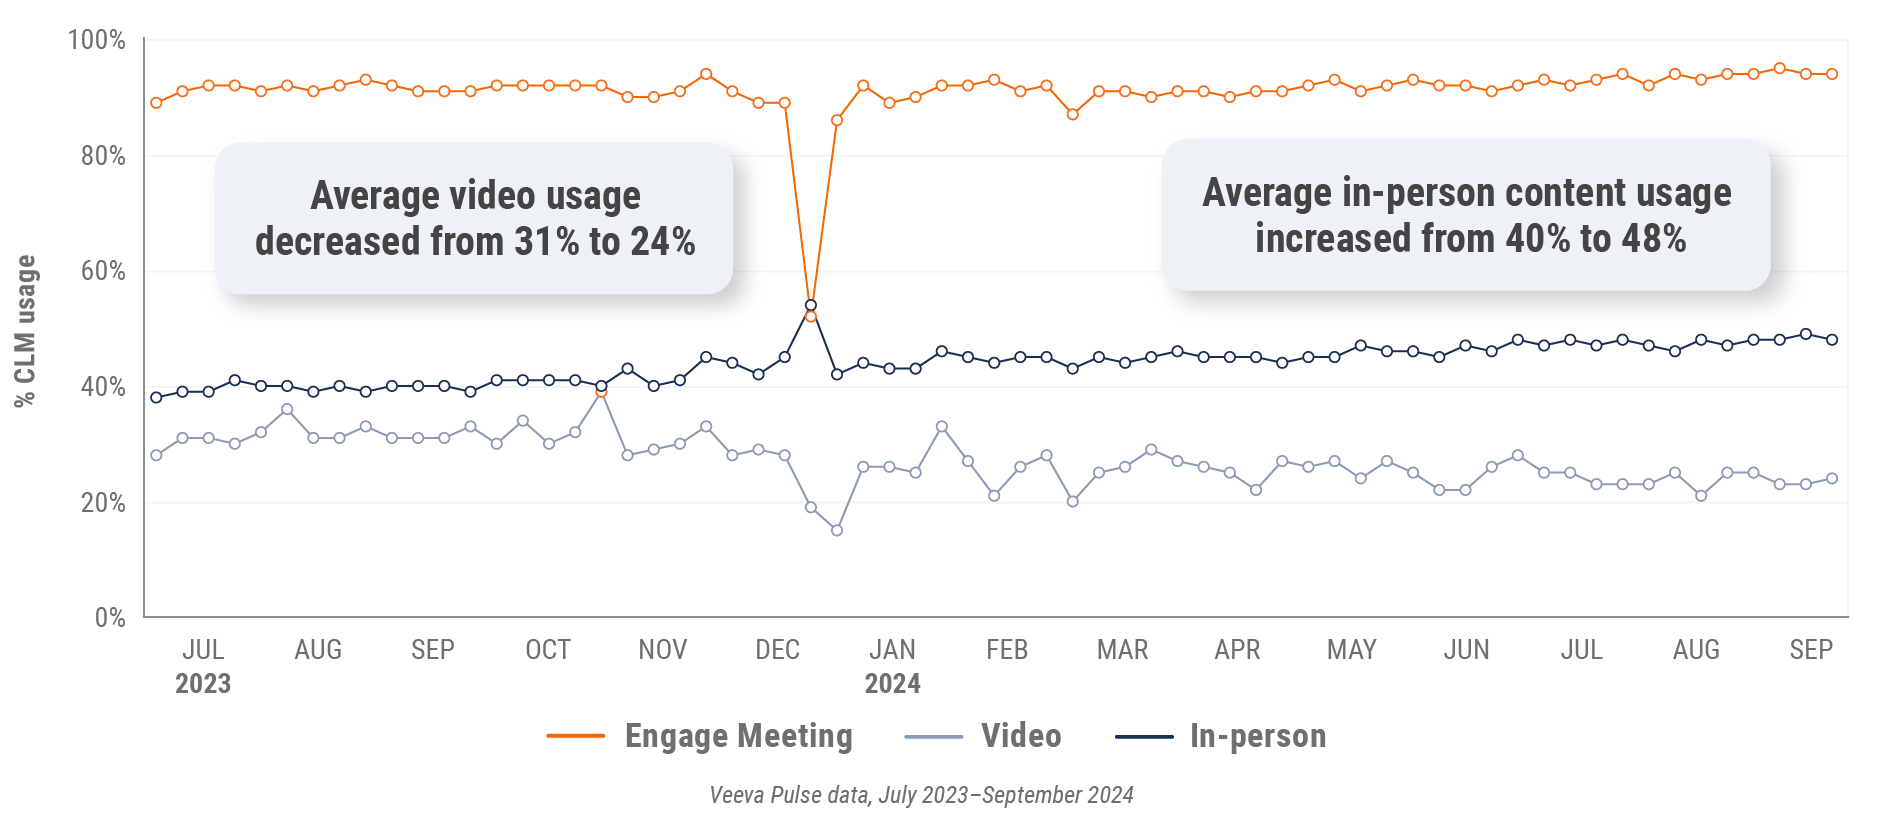
Figure 40: Veeva CRM Engage meeting duration, Latin America

Appendix: Data dictionary
Metric definitions
- Channel mix evolution over time: Weekly Veeva CRM activity volume broken down by the channel of engagement (in-person, phone, video, email, chat or text)
- Channel mix: Total Veeva CRM activity volume broken down by engagement channel percentage
- Weekly activities per user: The average weekly number of Veeva CRM activities submitted per number of users active in Veeva CRM
- Approved email volume: Volume of approved emails sent via Veeva CRM
- Email open rate: Percentage of approved emails opened at least once out of all approved emails sent via Veeva CRM
- Email click rate: Percentage of approved emails clicked at least once out of all approved emails sent via Veeva CRM
- In-person % CLM usage: Percentage of in-person engagements that leveraged content in Veeva CRM
- Video % CLM usage: Percentage of video engagements that leveraged content in Veeva CRM
- Veeva CRM Engage meeting % CLM usage: Percentage of Veeva CRM Engage meetings that leveraged content in Veeva CRM
- Veeva CRM Engage meeting duration: The average duration of Veeva CRM Engage meetings in minutes
Engagement channel definitions
- In-person: Submitted calls with a CRM Standard Metrics call channel value of ‘in-person’
- Phone: Submitted calls with a CRM Standard Metrics call channel value of ‘phone’
- Video: Veeva CRM Engage calls and video calls via other platforms that are then recorded as calls in Veeva CRM with a Standard Metrics call channel value of ‘video’
- Email: Approved emails and emails sent via other platforms that are then recorded as calls in Veeva CRM with a Standard Metrics call channel value of ‘email’
- Chat or text: Submitted calls with a CRM Standard Metrics call channel value of ‘chat or text’
User type definitions
- Sales: Users that have been classified with the ‘sales’ value in the CRM Standard Metrics user type field
- Key account manager: Users that have been classified with the ‘key account manager’ value in the CRM Standard Metrics user type field
- Medical: Users that have been classified with the ‘medical’ value in the CRM Standard Metrics user type field
- Top global biopharma: Top 17 global biopharma companies by revenue
- Rest of industry: All other biopharmas
Region definitions
- Global: All markets globally. This quarter’s global trends report omits data from China.
- Europe: Albania, Andorra, Armenia, Aruba, Austria, Azerbaijan, Belarus, Belgium, Bermuda, Bosnia and Herzegovina, Bulgaria, Croatia, Cyprus, Czech Republic, Denmark, Estonia, Finland, France, French Polynesia, Georgia, Germany, Greece, Greenland, Guadeloupe, Guernsey, Hungary, Ireland, Italy, Jersey, Latvia, Lithuania, Luxembourg, Macedonia, Malta, Martinique, Republic of Moldova, Monaco, Montenegro, Netherlands, New Caledonia, Norway, Poland, Portugal, Romania, Serbia, Slovakia, Slovenia, Spain, Sweden, Switzerland, Ukraine, United Kingdom
- Asia: Australia, Bangladesh, Bhutan, Brunei Darussalam, Cambodia, Cocos (Keeling) Islands, Indonesia, Japan, Kazakhstan, Republic of Korea, Kyrgyzstan, Malaysia, Mongolia, Myanmar, Nauru, Nepal, New Zealand, Philippines, Samoa, Singapore, Solomon Islands, Sri Lanka, Taiwan, Tajikistan, Thailand, Turkmenistan, Uzbekistan, Vietnam
- Latin America: Antigua and Barbuda, Argentina, Bahamas, Barbados, Belize, Bolivia, Brazil, Chile, Colombia, Costa Rica, Cuba, Dominican Republic, Ecuador, El Salvador, Guatemala, Guyana, Haiti, Honduras, Jamaica, Mexico, Nicaragua, Panama, Paraguay, Peru, Trinidad and Tobago, Uruguay, Venezuela
Methodology
The Veeva Pulse Field Trends Report is a quarterly industry benchmark for global and regional healthcare professional (HCP) engagement across the life sciences industry. The report is based on approximately 600 million annual global field activities captured in Veeva CRM and Veeva CRM Engage. In addition, this study used marketing effectiveness data from Veeva Crossix. Crossix connects anonymized health data on 300+ million patients to media data to measure the impact of direct-to-consumer and HCP marketing investments in the U.S.
The Veeva Pulse Field Trends Report delivers insights that inform the industry and help field teams align their strategy to key market trends for improved commercial success. The global Veeva Business Consulting team also helps customers inform their strategies using industry benchmarking with Veeva Pulse data.
Yearly share of channel mix and delivered email volume are calculated using average weekly percent changes during the specified period unless otherwise noted.